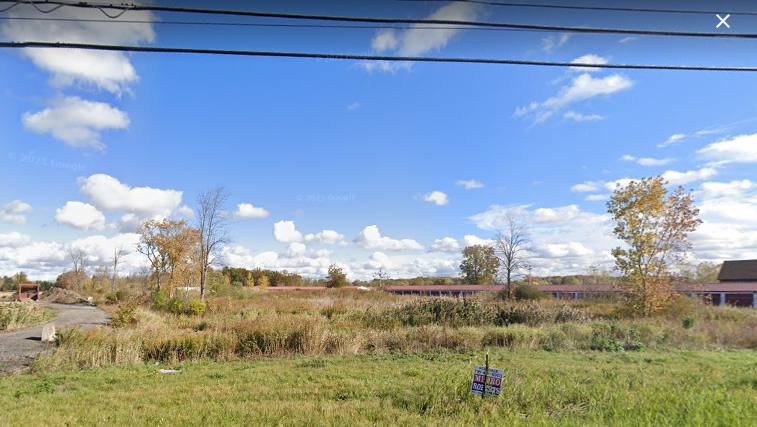
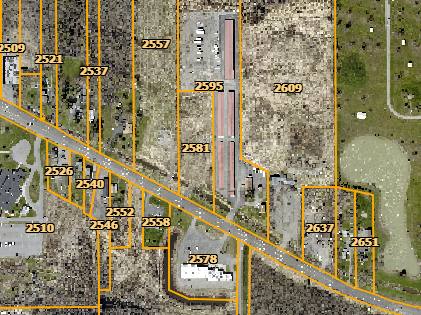
1-Mile | 3-Miles | 5-Miles | ||
---|---|---|---|---|
Total Population | 2,470 | 25,785 | 77,001 | |
Population Median Age | 44 | 43 | 43 | |
Population by Age | 0-9 Yrs | 174 (7%) | 2428 (9%) | 7329 (9%) |
10-19 Yrs | 372 (15%) | 2928 (11%) | 8706 (11%) | |
20-29 Yrs | 331 (13%) | 3285 (12%) | 9504 (12%) | |
30-39 Yrs | 161 (6%) | 2825 (10%) | 9558 (12%) | |
40-49 Yrs | 271 (10%) | 2928 (11%) | 8327 (10%) | |
50-59 Yrs | 229 (9%) | 3768 (14%) | 12093 (15%) | |
60-69 Yrs | 549 (22%) | 4059 (15%) | 11310 (14%) | |
70+ Yrs | 383 (15%) | 3563 (13%) | 10174 (13%) | |
Median HH Income | $82,100 | $69,373 | $66,531 | |
Total Household Income | < 24K | 57 (5%) | 1459 (13%) | 5134 (15%) |
25-49K | 225 (22%) | 2307 (21%) | 7158 (21%) | |
50-74K | 164 (16%) | 2119 (19%) | 6111 (18%) | |
75-99K | 168 (17%) | 1674 (15%) | 5091 (15%) | |
100-199K | 331 (33%) | 2902 (26%) | 8210 (24%) | |
200K+ | 43 (4%) | 413 (3%) | 1209 (3%) | |
Highest Education Level | No Diploma | 66 | 1354 | 4240 |
Diploma or GED | 576 | 5699 | 17420 | |
Some College | 302 | 3663 | 10987 | |
Assoc. Degree | 243 | 2893 | 8352 | |
Bachelors Degree | 372 | 3254 | 9167 | |
Higher Degree | 233 | 2204 | 6867 | |
Total Housing Units | 1,142 | 11,634 | 35,076 | |
--Owner-Occupied | 764 | 8,375 | 25,182 | |
--Renter-Occupied | 223 | 2,499 | 7,732 | |
Owner-Occupied Values | < 100K | 24 | 2097 | 7426 |
100-199K | 224 | 3388 | 10220 | |
200-299K | 417 | 2101 | 5115 | |
300-399K | 93 | 563 | 1426 | |
400-499K | 1 | 123 | 359 | |
500K+ | 4 | 103 | 635 | |
Total Working Age Population | 2,109 | 21,462 | 64,371 | |
In Work Force | 1,257 | 13,683 | 40,738 | |
Not In Work Force | 852 | 7,778 | 23,633 | |
Workforce Employed | 1,231 | 13,191 | 38,538 | |
Workforce Unemployed | 26 | 465 | 2,143 | |
Civlian Workforce | 1,256 | 13,657 | 40,681 | |
Military Workforce | 1 | 27 | 56 | |
Total Households | 987 | 10,874 | 32,914 | |
Family Households | 745 | 7,030 | 21,064 | |
Non-Family Households | 243 | 3,844 | 11,850 | |
Married Couple | 617 | 5,293 | 16,373 | |
Other Family | 128 | 1,737 | 4,691 | |
Married w/Child | 168 | 1,703 | 5,352 | |
Single Male w/Child | 54 | 308 | 661 | |
Single Female w/Child | 32 | 388 | 1,523 |
Population Change Last Two Decades - Plus Projection
2000 | % | 2010 | % | 2020 | % | 2030 | |
---|---|---|---|---|---|---|---|
New York | 18,976,457 | +2 | 19,378,102 | +4 | 20,146,131 | +2 | 20,604,030 |
Erie County | 950,265 | -3 | 919,040 | +2 | 936,084 | +1 | 949,073 |
Niagara County | 219,846 | -2 | 216,469 | -3 | 209,940 | -3 | 202,950 |
Total Working Age Population:
Total Households:
Total Working Age Population:
Total Households:
Total Working Age Population:
Total Households: