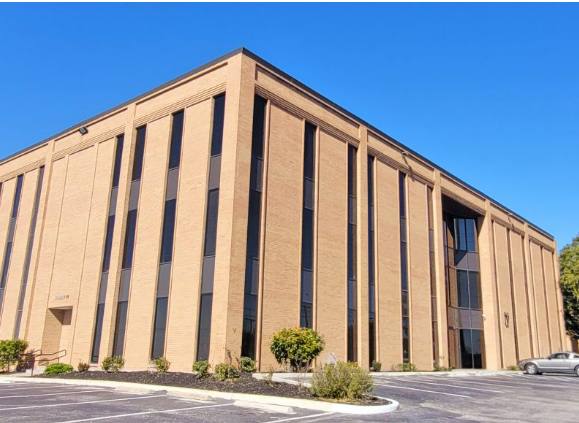
Office Space
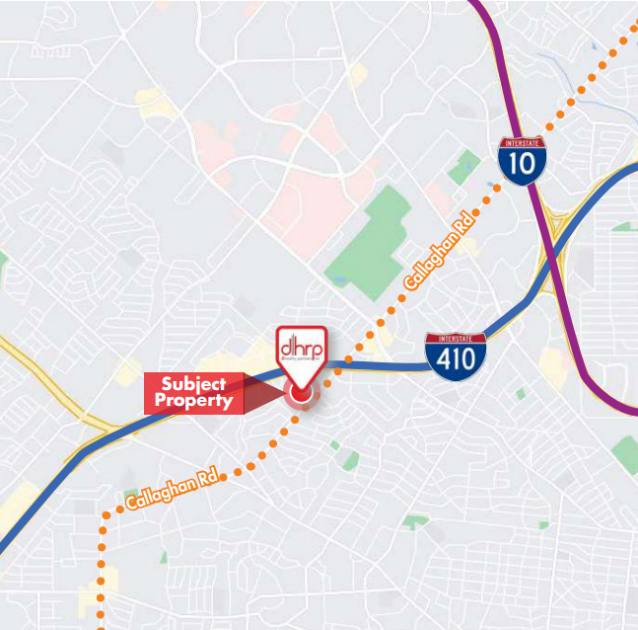
5805 Callaghan Road San Antonio, TX 78228
5805 Callaghan Road San Antonio, TX 78228
Details & Description
Property Highlights
- • 24/7 Keypad Access
- • Security Surveillance System
- • Janitorial Service 5x Per Week
- • On-site management office
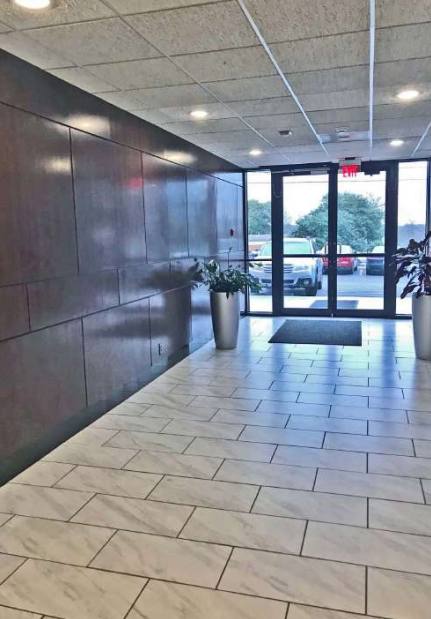
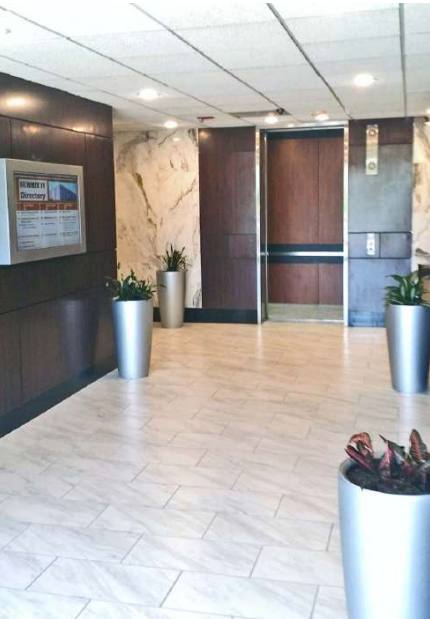
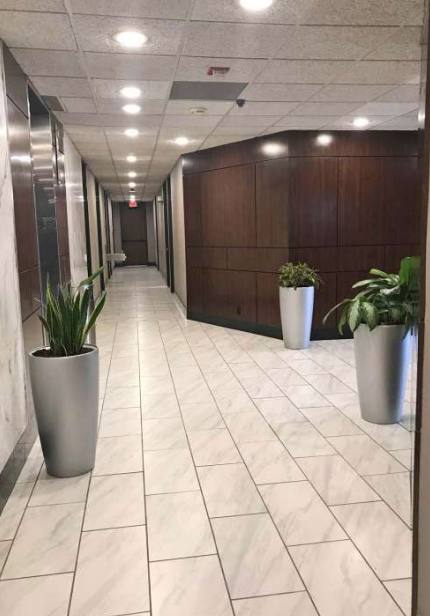
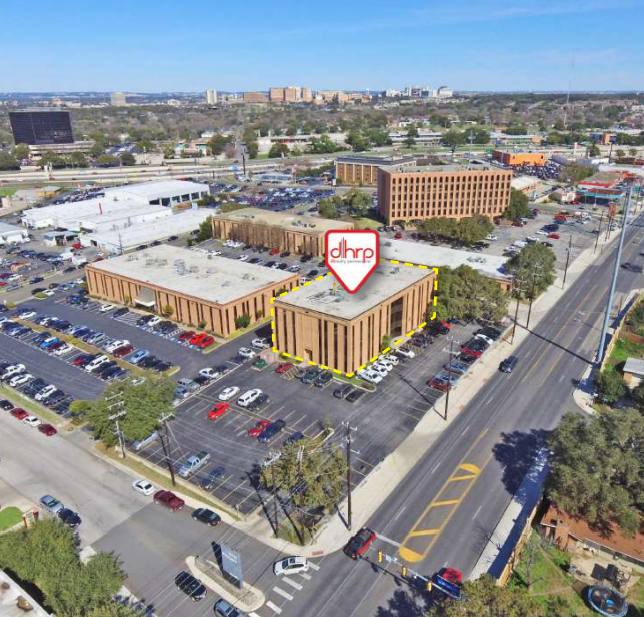
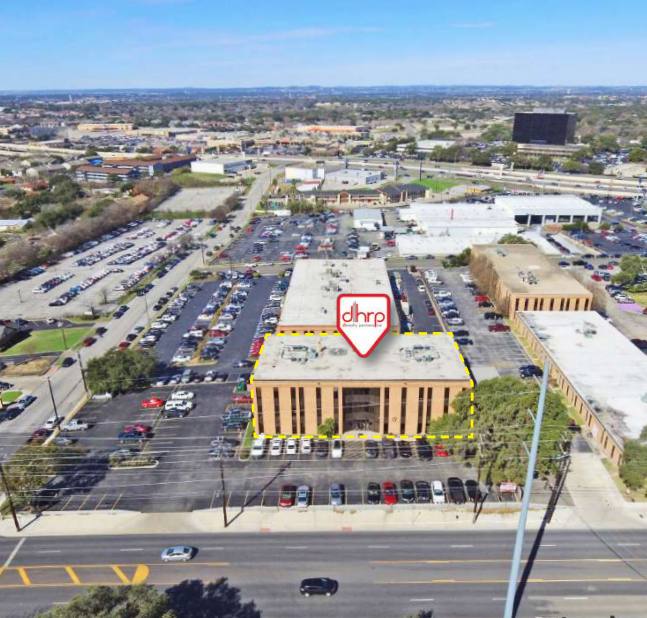
Additional Photos

Listing Agents

Marie Goga
O: 210-222-2424
M: 210-412-6262
mgoga@dhrp.us
O: 210-222-2424
M: 210-412-6262
mgoga@dhrp.us
While we strive to provide the most accurate information, all listing information, and demographic data, is provided by third-parties. As such, MyEListing will not be responsible for the accuracy of the information. It is strongly recommended that you verify all information with the listing agent, and any relevant agencies, prior to making any decisions.