Flex-Office-Warehouse
15501 Ranch Road 620 North Austin, TX 78717
15501 Ranch Road 620 North Austin, TX 78717

Details & Description
Property Highlights
- • Fits 2 - 6 People
- • 3 Private Offices
- • 24 Hour Access
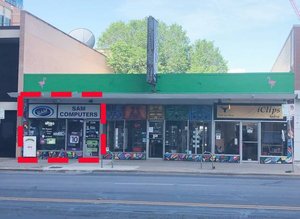
- • Pylon Sign
- • Air Conditioning
Listing Agents

Neil Stokes
O: 512-633-2233
neil@specialagentgroup.com
O: 512-633-2233
neil@specialagentgroup.com
While we strive to provide the most accurate information, all listing information, and demographic data, is provided by third-parties. As such, MyEListing will not be responsible for the accuracy of the information. It is strongly recommended that you verify all information with the listing agent, and any relevant agencies, prior to making any decisions.