Office Space
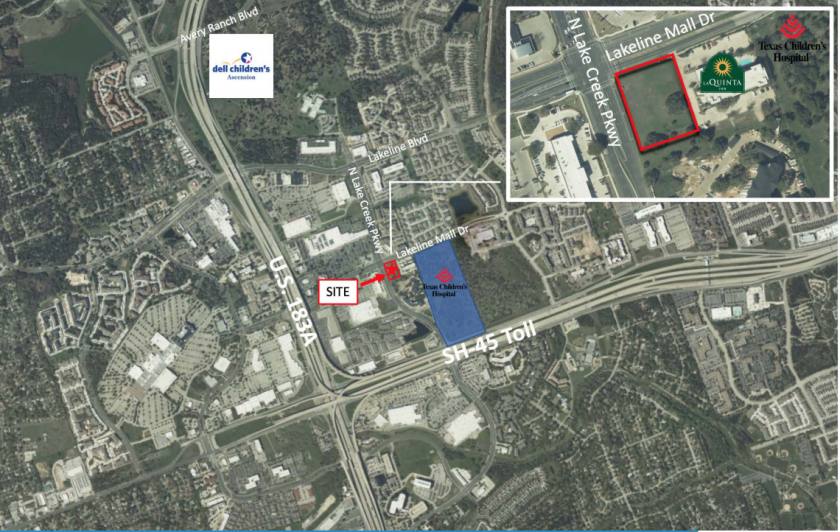
9817 North Lake Creek Parkway Austin, TX 78717
9817 North Lake Creek Parkway Austin, TX 78717
Details & Description
Property Highlights
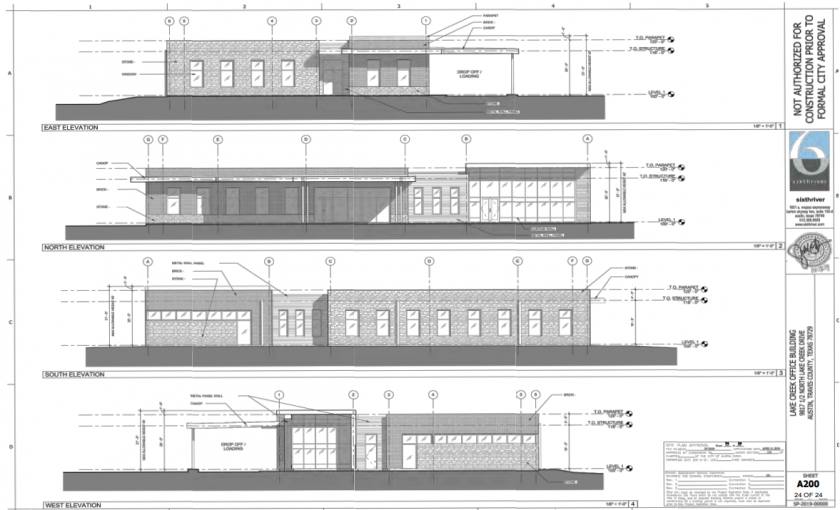
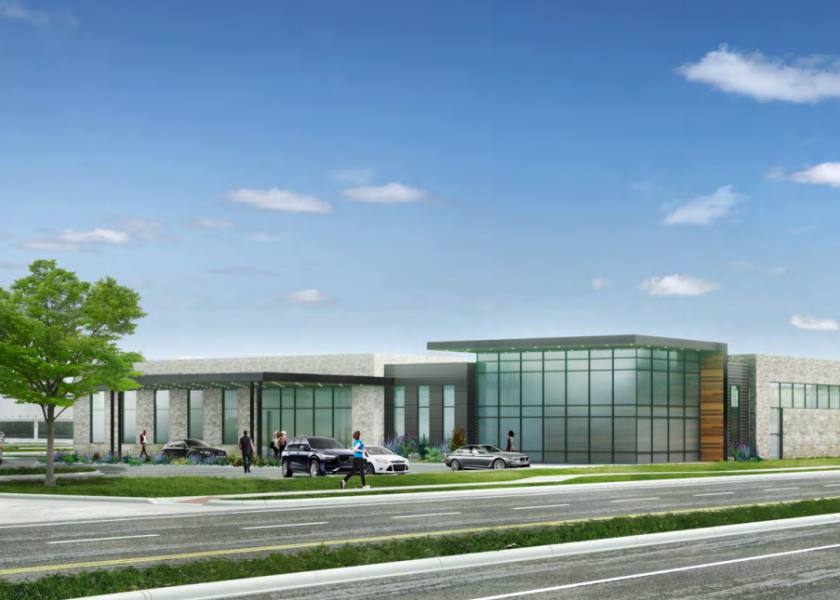
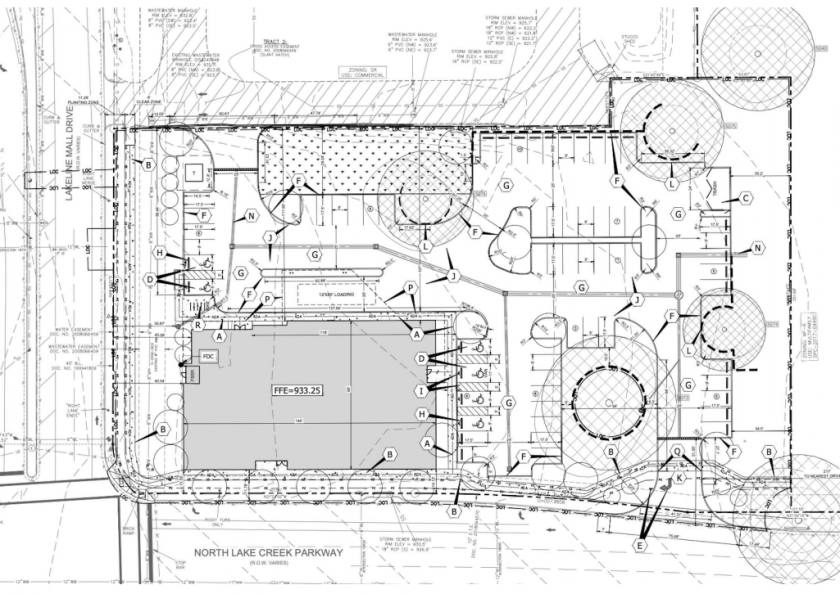
- • Approx. 12,500 SF Medical / Office Building
- • Signalized intersection
- • Building and monument signage available
- • Major area retailers
Additional Photos


Listing Agents

Will Blackbird
O: 512-327-6586
wblackbird@hthcapital.com
O: 512-327-6586
wblackbird@hthcapital.com
While we strive to provide the most accurate information, all listing information, and demographic data, is provided by third-parties. As such, MyEListing will not be responsible for the accuracy of the information. It is strongly recommended that you verify all information with the listing agent, and any relevant agencies, prior to making any decisions.