Office Space
901 West 38th Street Austin, TX 78705
901 West 38th Street Austin, TX 78705
Details & Description
Property Highlights
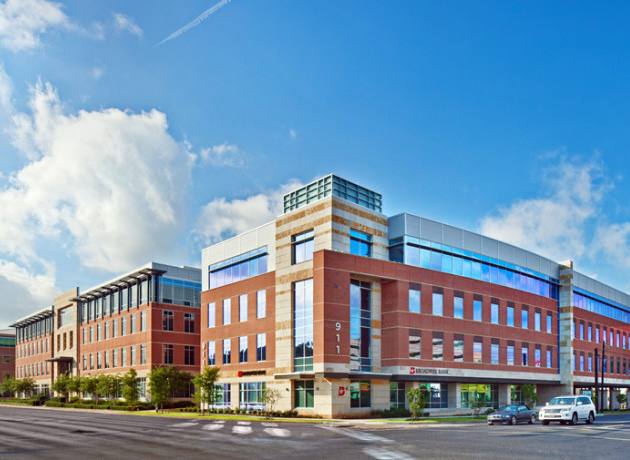
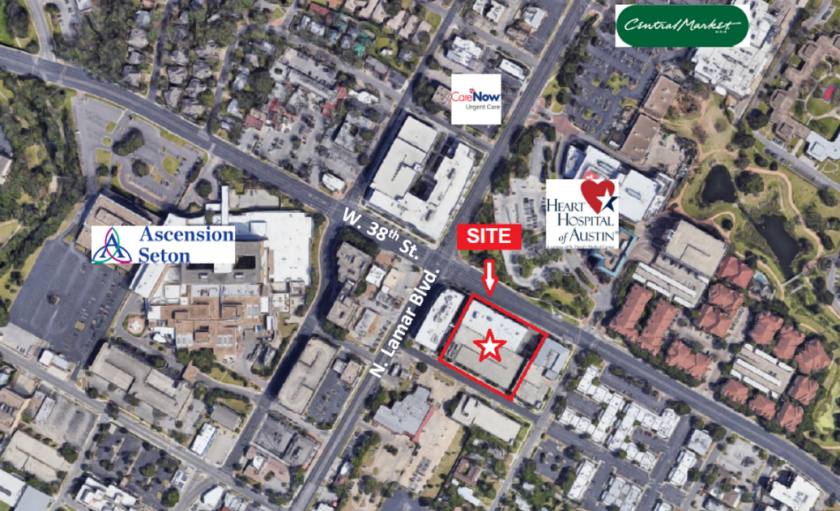
• Class A Medical Office Building located on 38th St. and N Lamar convenient to Ascension Seton Hospital & Heart Hospi
• Close proximity to numerous amenities that include retail, supermarkets, restaurants, and banks
Additional Photos
Listing Agents

Will Blackbird
O: 512-327-6586
wblackbird@hthcapital.com
O: 512-327-6586
wblackbird@hthcapital.com
While we strive to provide the most accurate information, all listing information, and demographic data, is provided by third-parties. As such, MyEListing will not be responsible for the accuracy of the information. It is strongly recommended that you verify all information with the listing agent, and any relevant agencies, prior to making any decisions.


