Office Space
805 North Murray Boulevard Colorado Springs, CO 80915
805 North Murray Boulevard Colorado Springs, CO 80915

Details & Description
Property Highlights
- • Security System & Video Surveillance
- • Two Large Garage Spaces
- • Elevator/ADA Access Available
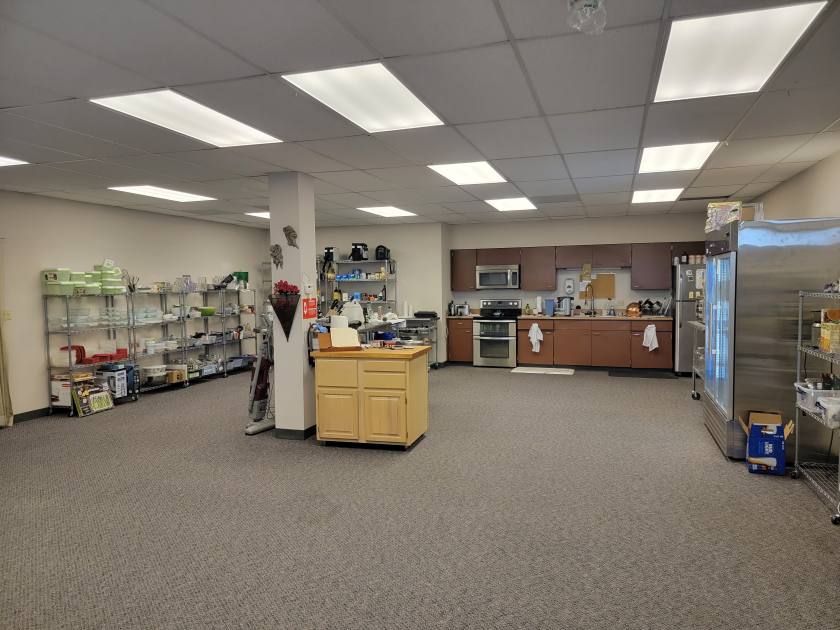
- • Kitchen/Break Area
- • Former Ent Federal Credit Union Headquarters
- • Backup Generator
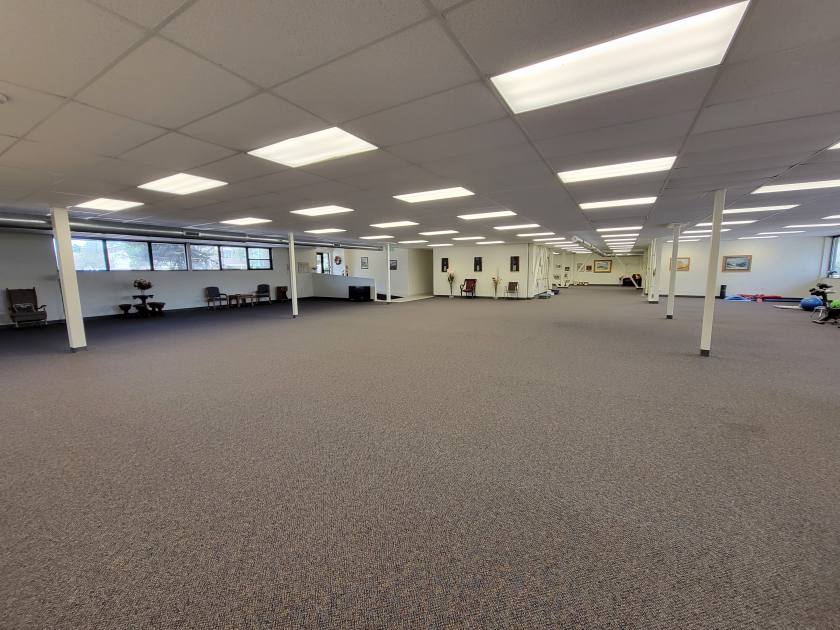
Additional Photos


Listing Agents

Jason Castro
jason@peakcp.net
jason@peakcp.net
While we strive to provide the most accurate information, all listing information, and demographic data, is provided by third-parties. As such, MyEListing will not be responsible for the accuracy of the information. It is strongly recommended that you verify all information with the listing agent, and any relevant agencies, prior to making any decisions.


