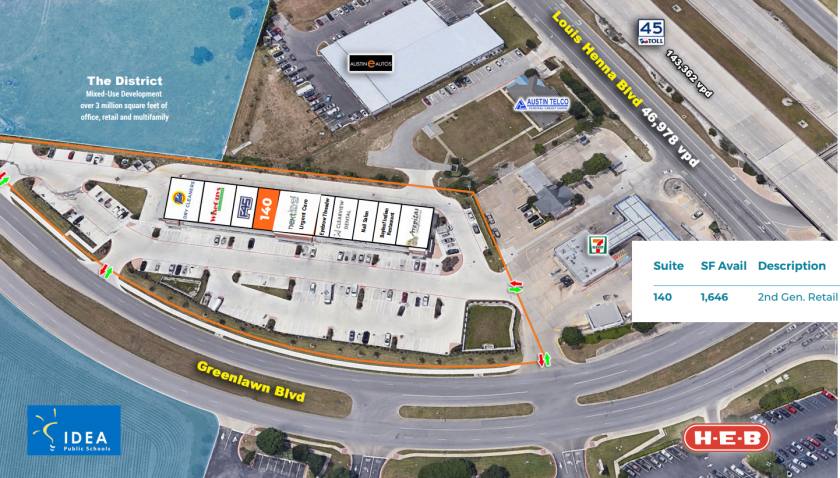
1-Mile | 3-Miles | 5-Miles | ||
---|---|---|---|---|
Total Population | 9,410 | 103,438 | 241,544 | |
Population Median Age | 34 | 35 | 35 | |
Population by Age | 0-9 Yrs | 1129 (11%) | 12997 (12%) | 31502 (13%) |
10-19 Yrs | 1084 (11%) | 13884 (13%) | 34997 (14%) | |
20-29 Yrs | 2090 (22%) | 15916 (15%) | 34589 (14%) | |
30-39 Yrs | 1498 (15%) | 18277 (17%) | 40104 (16%) | |
40-49 Yrs | 1500 (15%) | 16393 (15%) | 37960 (15%) | |
50-59 Yrs | 979 (10%) | 12021 (11%) | 30358 (12%) | |
60-69 Yrs | 736 (7%) | 8605 (8%) | 19408 (8%) | |
70+ Yrs | 393 (4%) | 5346 (5%) | 12626 (5%) | |
Median HH Income | $78,201 | $77,691 | $84,220 | |
Total Household Income | < 24K | 324 (8%) | 4208 (11%) | 7227 (8%) |
25-49K | 827 (22%) | 6675 (17%) | 14500 (17%) | |
50-74K | 600 (16%) | 7167 (19%) | 15682 (18%) | |
75-99K | 617 (16%) | 6100 (16%) | 13546 (15%) | |
100-199K | 1188 (32%) | 11381 (30%) | 27338 (32%) | |
200K+ | 105 (2%) | 1883 (5%) | 6518 (7%) | |
Highest Education Level | No Diploma | 331 | 5726 | 12126 |
Diploma or GED | 1423 | 15103 | 32943 | |
Some College | 1804 | 16274 | 36594 | |
Assoc. Degree | 594 | 6356 | 12851 | |
Bachelors Degree | 1761 | 19640 | 45975 | |
Higher Degree | 698 | 6902 | 20773 | |
Total Housing Units | 4,074 | 40,199 | 90,197 | |
--Owner-Occupied | 1,949 | 19,379 | 48,998 | |
--Renter-Occupied | 1,710 | 18,035 | 35,812 | |
Owner-Occupied Values | < 100K | 18 | 570 | 1641 |
100-199K | 630 | 5292 | 10113 | |
200-299K | 952 | 9269 | 21492 | |
300-399K | 304 | 3482 | 10725 | |
400-499K | 45 | 480 | 2928 | |
500K+ | 1 | 286 | 2099 | |
Total Working Age Population | 7,902 | 82,219 | 188,511 | |
In Work Force | 6,322 | 62,842 | 142,383 | |
Not In Work Force | 1,580 | 19,378 | 46,128 | |
Workforce Employed | 6,026 | 59,536 | 135,645 | |
Workforce Unemployed | 296 | 3,191 | 6,447 | |
Civlian Workforce | 6,321 | 62,727 | 142,092 | |
Military Workforce | 1 | 114 | 291 | |
Total Households | 3,660 | 37,413 | 84,811 | |
Family Households | 2,406 | 24,703 | 57,303 | |
Non-Family Households | 1,254 | 12,711 | 27,508 | |
Married Couple | 1,915 | 18,091 | 43,525 | |
Other Family | 491 | 6,612 | 13,778 | |
Married w/Child | 976 | 8,609 | 21,836 | |
Single Male w/Child | 73 | 880 | 2,098 | |
Single Female w/Child | 145 | 2,857 | 5,837 |
Population Change Last Two Decades - Plus Projection
2000 | % | 2010 | % | 2020 | % | 2030 | |
---|---|---|---|---|---|---|---|
Texas | 20,851,820 | +21 | 25,145,561 | +18 | 29,677,668 | +18 | 34,894,452 |
Travis County | 812,280 | +26 | 1,024,266 | +26 | 1,291,502 | +19 | 1,540,812 |
Williamson County | 249,967 | +69 | 422,679 | +40 | 589,914 | +41 | 830,421 |
Total Working Age Population:
Total Households:
Total Working Age Population:
Total Households:
Total Working Age Population:
Total Households: