Industrial Properties
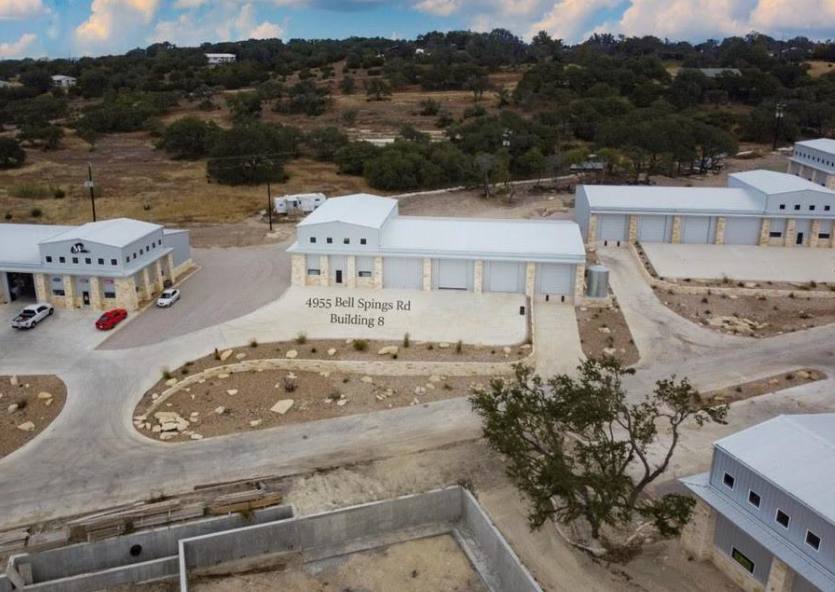
4955 Bell Springs Road Dripping Springs, TX 78620
4955 Bell Springs Road Dripping Springs, TX 78620

Details & Description
Property Highlights
- • Amazing Location
- • Stone Facade
- • Exceptional Architecture
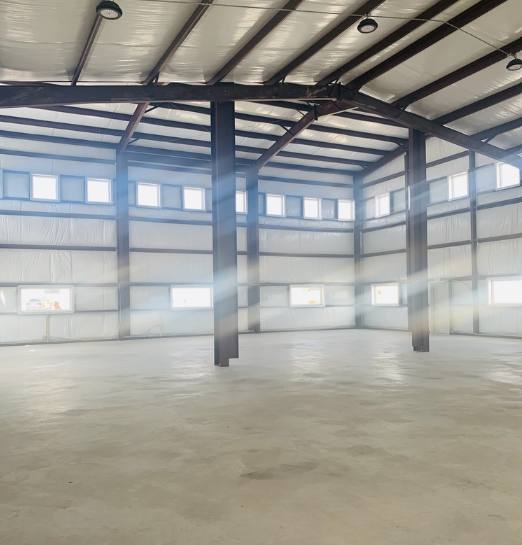
- • Envelope
- • Great selection of neighboring Tenants
- • Great views
Additional Photos


Listing Agents

Martha Denham
O: 512-912-1070
M: 512-831-8586
martha@cmeatx.com
O: 512-912-1070
M: 512-831-8586
martha@cmeatx.com
While we strive to provide the most accurate information, all listing information, and demographic data, is provided by third-parties. As such, MyEListing will not be responsible for the accuracy of the information. It is strongly recommended that you verify all information with the listing agent, and any relevant agencies, prior to making any decisions.


