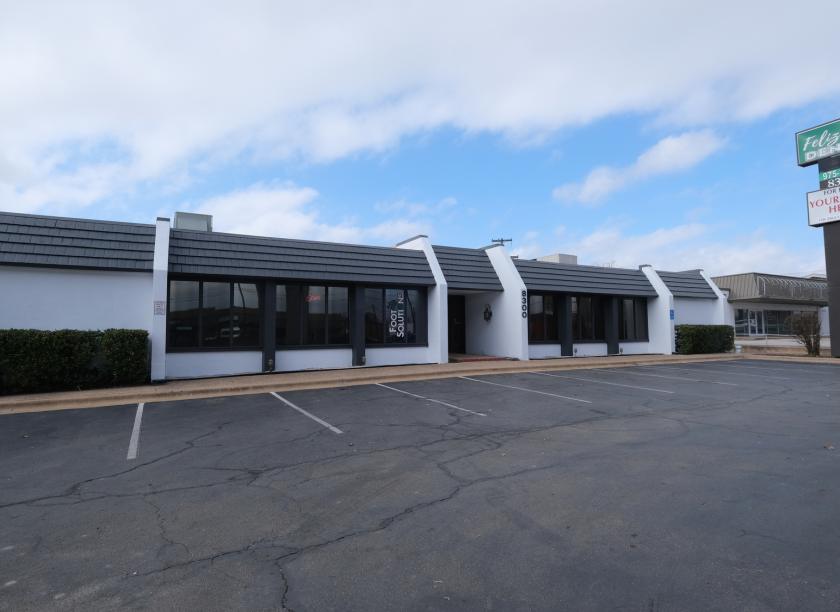
1-Mile | 3-Miles | 5-Miles | ||
---|---|---|---|---|
Total Population | 25,553 | 160,305 | 342,670 | |
Population Median Age | 34 | 35 | 35 | |
Population by Age | 0-9 Yrs | 3363 (13%) | 20202 (12%) | 39709 (11%) |
10-19 Yrs | 3574 (13%) | 16781 (10%) | 36511 (10%) | |
20-29 Yrs | 3921 (15%) | 30295 (18%) | 70030 (20%) | |
30-39 Yrs | 5527 (21%) | 34523 (21%) | 68683 (20%) | |
40-49 Yrs | 3643 (14%) | 20450 (12%) | 43445 (12%) | |
50-59 Yrs | 2534 (9%) | 16250 (10%) | 34732 (10%) | |
60-69 Yrs | 1782 (6%) | 11932 (7%) | 27298 (7%) | |
70+ Yrs | 1211 (4%) | 9872 (6%) | 22263 (6%) | |
Median HH Income | $57,913 | $57,840 | $67,265 | |
Total Household Income | < 24K | 2448 (25%) | 13474 (19%) | 24864 (17%) |
25-49K | 1780 (18%) | 15912 (23%) | 29331 (20%) | |
50-74K | 1878 (19%) | 11639 (17%) | 24651 (17%) | |
75-99K | 917 (9%) | 8320 (12%) | 17511 (12%) | |
100-199K | 2064 (21%) | 13725 (20%) | 33676 (23%) | |
200K+ | 625 (6%) | 4557 (6%) | 14021 (9%) | |
Highest Education Level | No Diploma | 3717 | 17058 | 25279 |
Diploma or GED | 3859 | 20779 | 35336 | |
Some College | 3061 | 18065 | 37377 | |
Assoc. Degree | 687 | 5784 | 11686 | |
Bachelors Degree | 4187 | 32015 | 77380 | |
Higher Degree | 2028 | 19644 | 51295 | |
Total Housing Units | 10,485 | 73,118 | 156,213 | |
--Owner-Occupied | 3,442 | 23,881 | 57,752 | |
--Renter-Occupied | 6,269 | 43,746 | 86,302 | |
Owner-Occupied Values | < 100K | 147 | 986 | 1830 |
100-199K | 574 | 3580 | 6937 | |
200-299K | 700 | 5077 | 11199 | |
300-399K | 830 | 4386 | 11079 | |
400-499K | 760 | 3950 | 8934 | |
500K+ | 429 | 5901 | 17774 | |
Total Working Age Population | 20,060 | 129,226 | 282,816 | |
In Work Force | 14,635 | 96,211 | 206,911 | |
Not In Work Force | 5,425 | 33,015 | 75,905 | |
Workforce Employed | 13,798 | 91,537 | 197,195 | |
Workforce Unemployed | 837 | 4,643 | 9,602 | |
Civlian Workforce | 14,635 | 96,180 | 206,796 | |
Military Workforce | 0 | 31 | 114 | |
Total Households | 9,711 | 67,627 | 144,055 | |
Family Households | 4,944 | 32,465 | 69,601 | |
Non-Family Households | 4,767 | 35,162 | 74,453 | |
Married Couple | 3,069 | 22,597 | 50,941 | |
Other Family | 1,876 | 9,869 | 18,660 | |
Married w/Child | 1,752 | 10,646 | 22,217 | |
Single Male w/Child | 121 | 1,359 | 2,449 | |
Single Female w/Child | 807 | 3,795 | 7,181 |
Population Change Last Two Decades - Plus Projection
2000 | % | 2010 | % | 2020 | % | 2030 | |
---|---|---|---|---|---|---|---|
Texas | 20,851,820 | +21 | 25,145,561 | +18 | 29,677,668 | +18 | 34,894,452 |
Travis County | 812,280 | +26 | 1,024,266 | +26 | 1,291,502 | +19 | 1,540,812 |
Total Working Age Population:
Total Households:
Total Working Age Population:
Total Households:
Total Working Age Population:
Total Households: