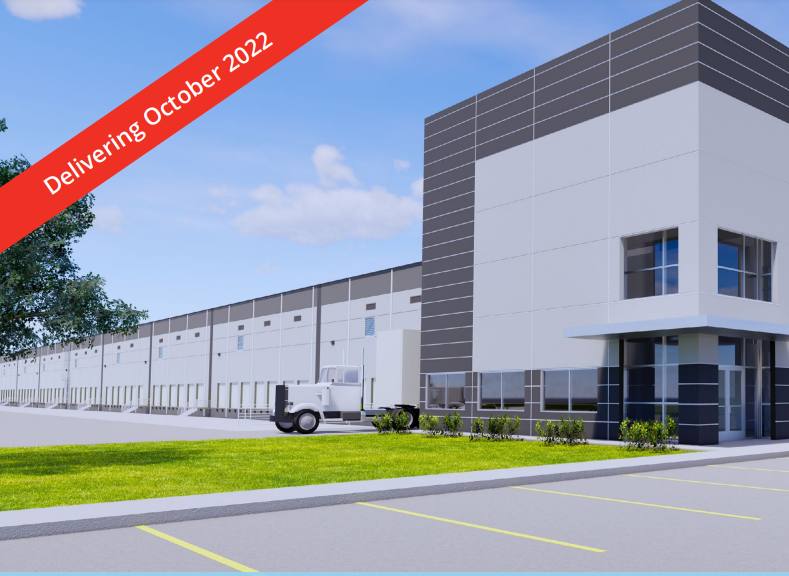
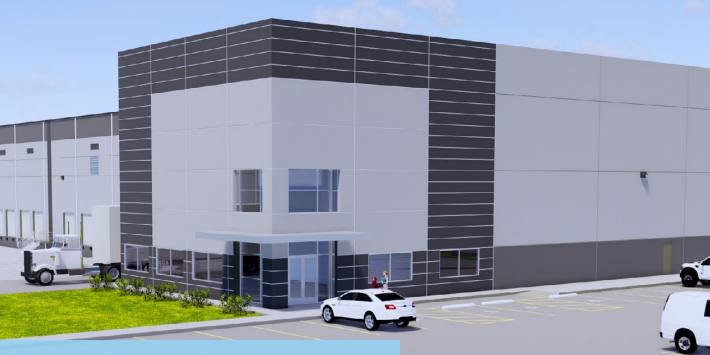
Flex-Office-Warehouse
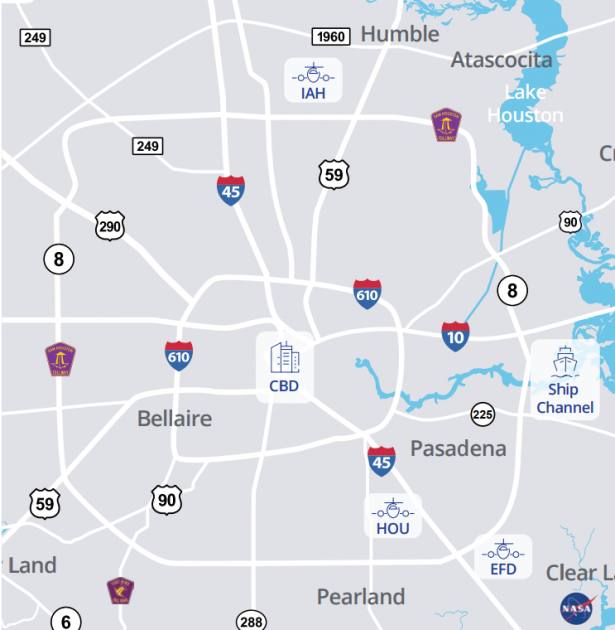
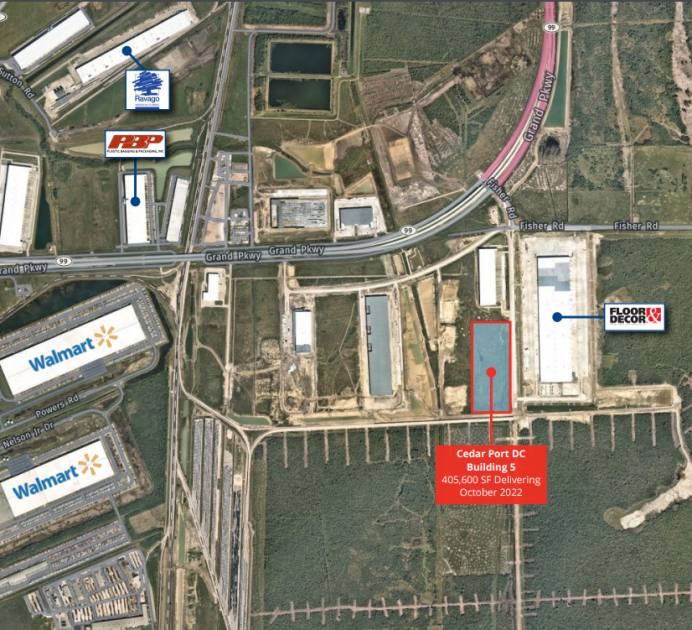
12317 Tri City Beach Rd Baytown, TX 77523
12317 Tri City Beach Rd Baytown, TX 77523
Details & Description
Property Highlights
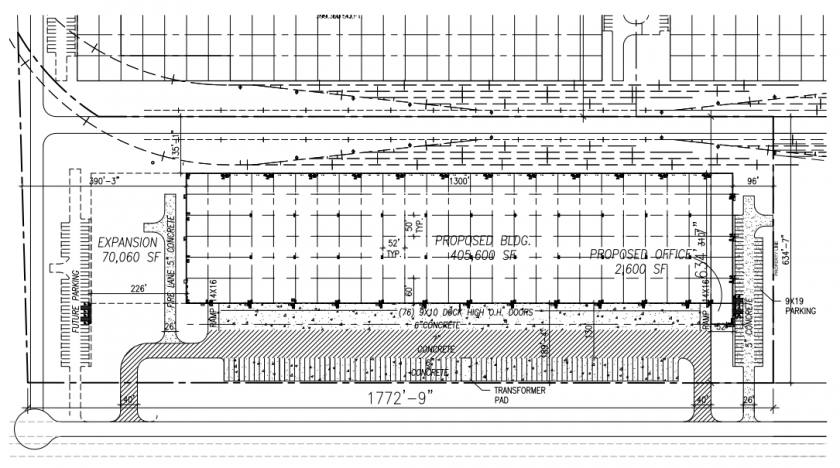
- • 2,600 SF Spec
- • + 26.2 Acres
- • 90 trailer parks and 72 car parks
- • Clear Height - 32'
- • Truck Court - 180'
- • Regional detention provided
Additional Photos
Listing Agents

Walker Barnett
O: 713-830-2127
M: 832-423-7063
walker.barnett@colliers.com
O: 713-830-2127
M: 832-423-7063
walker.barnett@colliers.com
While we strive to provide the most accurate information, all listing information, and demographic data, is provided by third-parties. As such, MyEListing will not be responsible for the accuracy of the information. It is strongly recommended that you verify all information with the listing agent, and any relevant agencies, prior to making any decisions.


