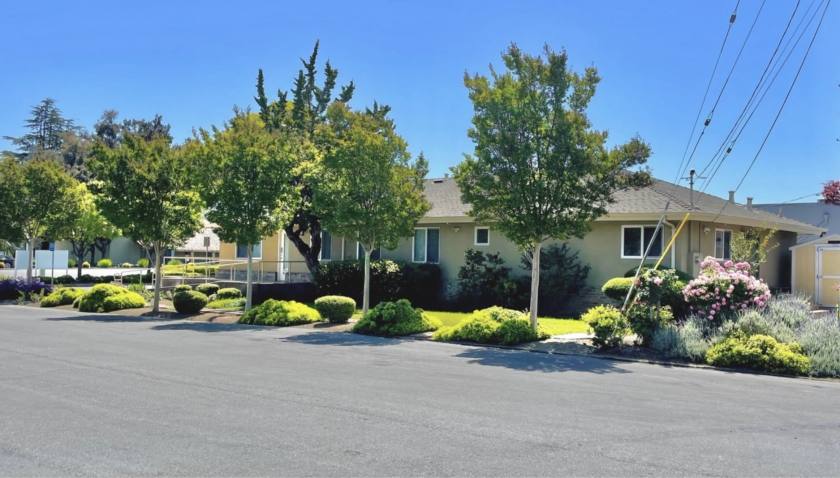
Office Space
10201 South De Anza Boulevard Cupertino, CA 95014
10201 South De Anza Boulevard Cupertino, CA 95014
Details & Description
Property Highlights
- • Zoning: General Commercial (CG)
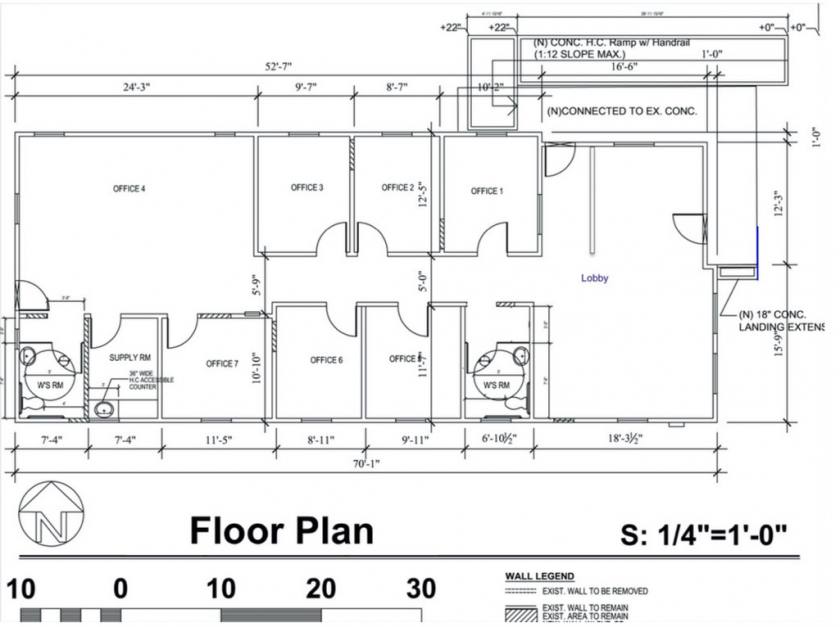
- • Space Available: ~2028 SF
- • Lot Size: ~8775 SF
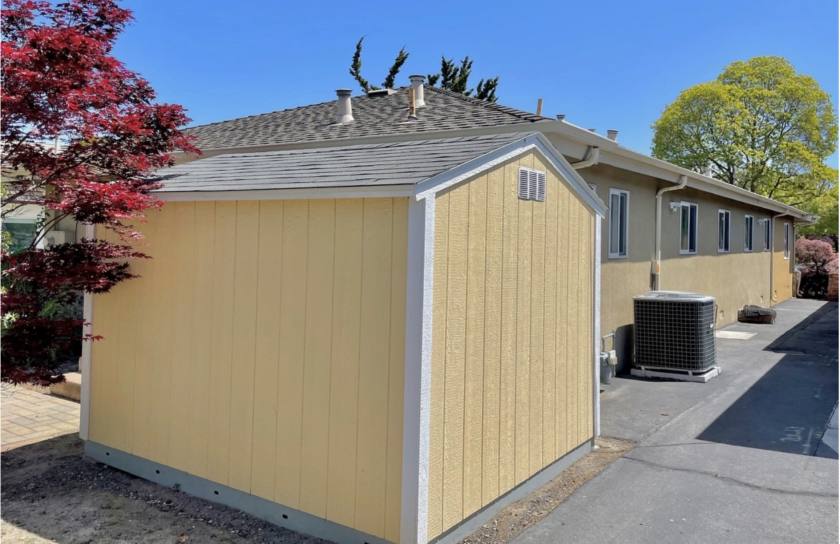
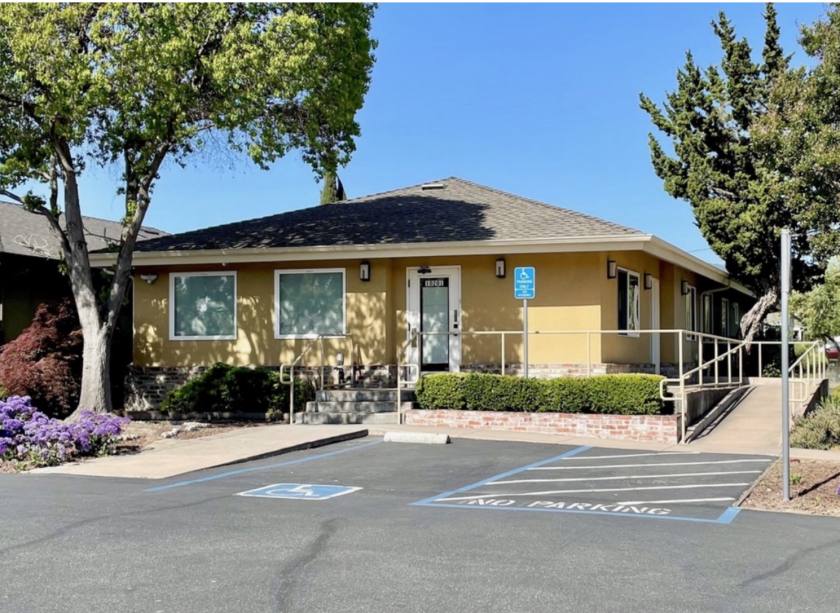
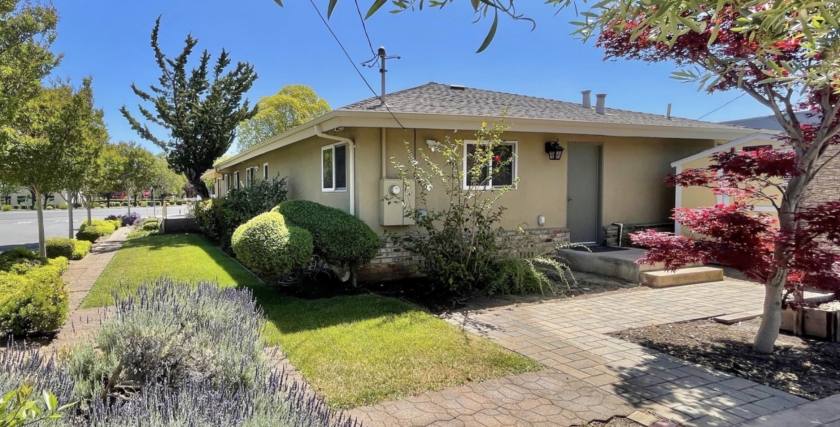
- • Space Type: Office Building
- • Parcel Number: 359-10-044
- • Building Class: A
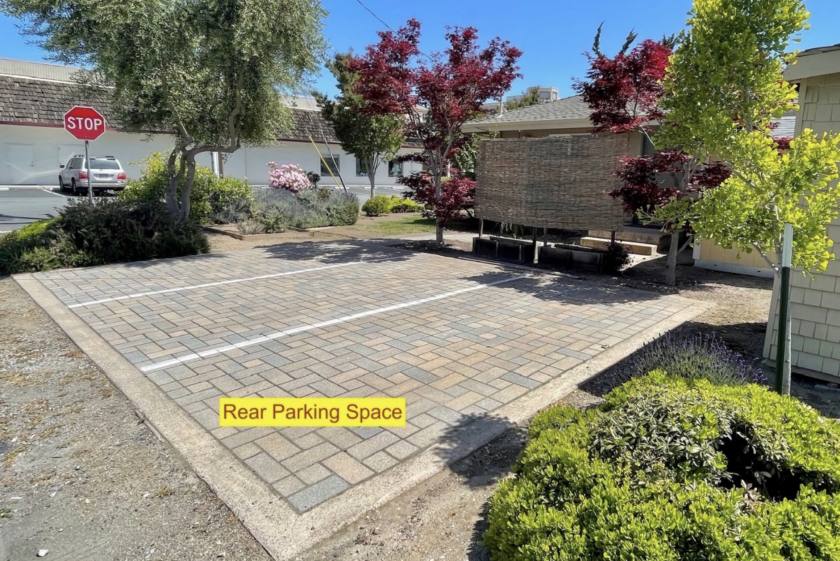
Additional Photos
Listing Agents

Frank Liang
O: 408-692-5368
M: 408-692-5368
bldg10201@outlook.com
O: 408-692-5368
M: 408-692-5368
bldg10201@outlook.com
While we strive to provide the most accurate information, all listing information, and demographic data, is provided by third-parties. As such, MyEListing will not be responsible for the accuracy of the information. It is strongly recommended that you verify all information with the listing agent, and any relevant agencies, prior to making any decisions.