Industrial Properties
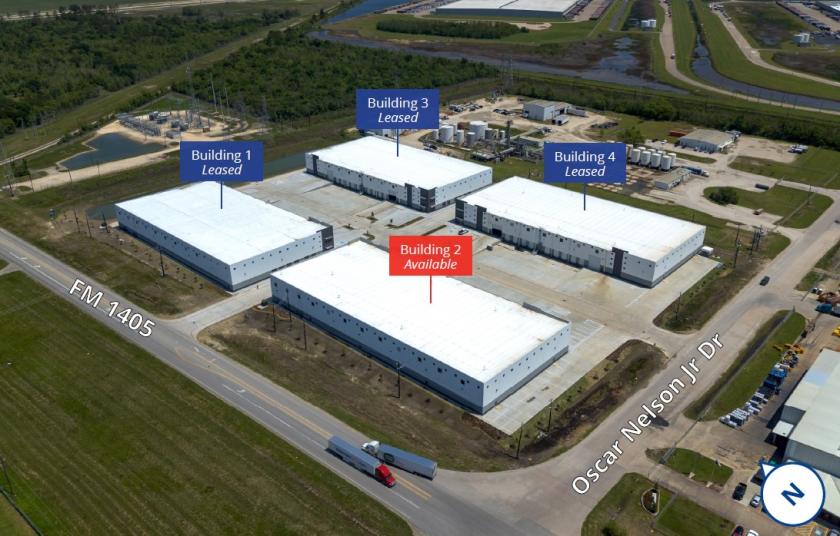
FM 1405 and Oscar Nelson Jr Dr Baytown, TX 77523
FM 1405 and Oscar Nelson Jr Dr Baytown, TX 77523
Details & Description
Property Highlights
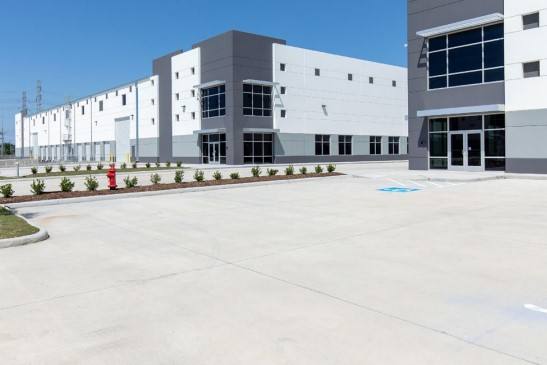
- • 49,792 SF available
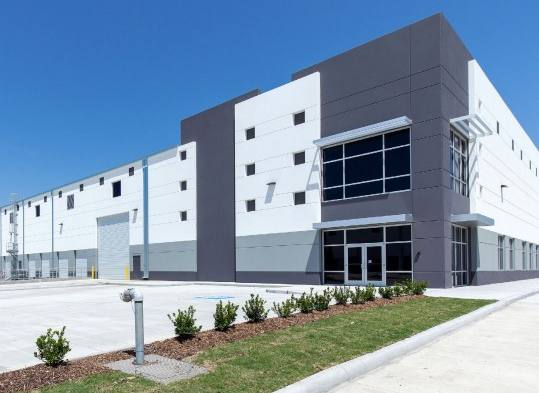
- • BTS office
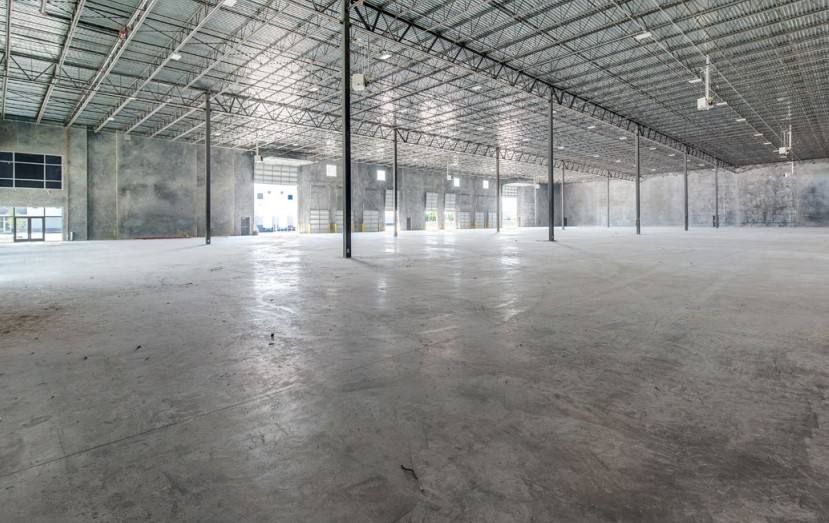
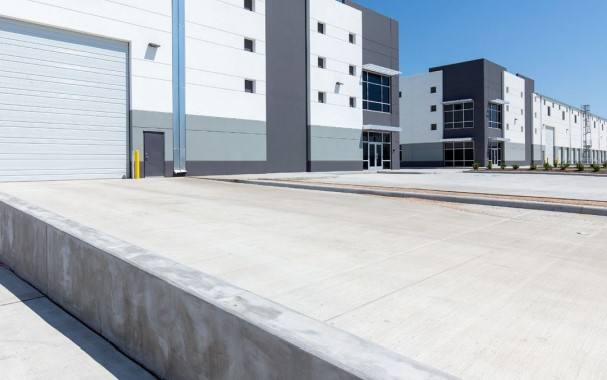
- • Built in 2020, tiltwall constructed
- • 1,000 amps of power
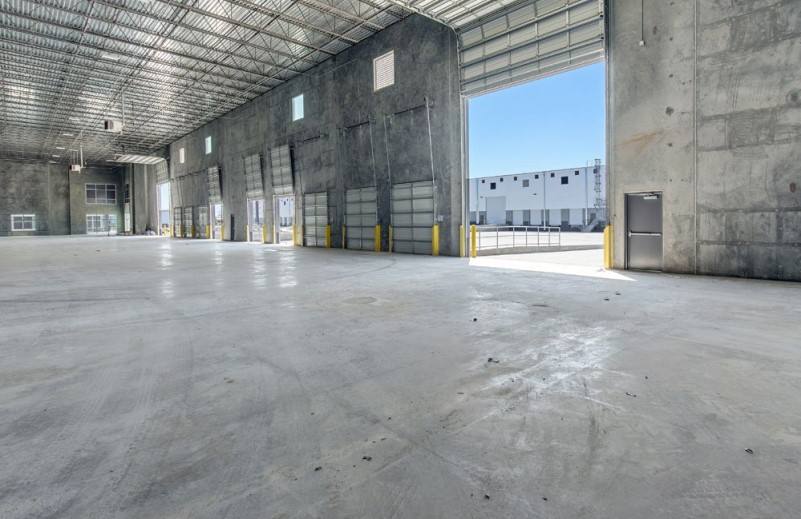
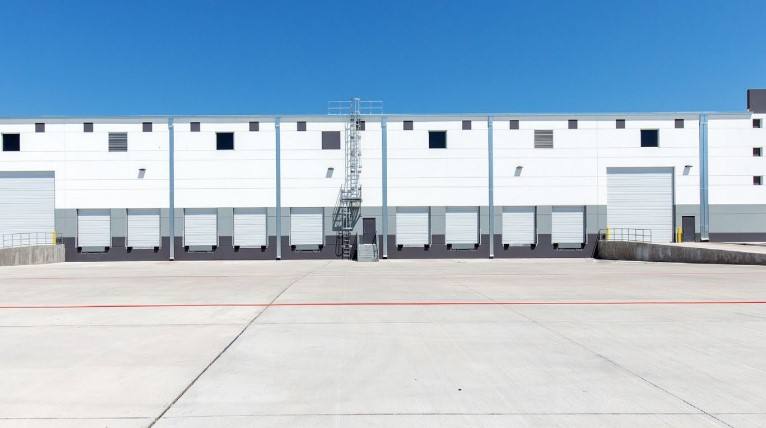
- • Dock-high loading and 200' truck courts
- • 32' clear height
Additional Photos
Listing Agents

Ryan Byrd
O: 713-830-2171
M: 832-368-4884
ryan.byrd@colliers.com
O: 713-830-2171
M: 832-368-4884
ryan.byrd@colliers.com
While we strive to provide the most accurate information, all listing information, and demographic data, is provided by third-parties. As such, MyEListing will not be responsible for the accuracy of the information. It is strongly recommended that you verify all information with the listing agent, and any relevant agencies, prior to making any decisions.