Commercial Land
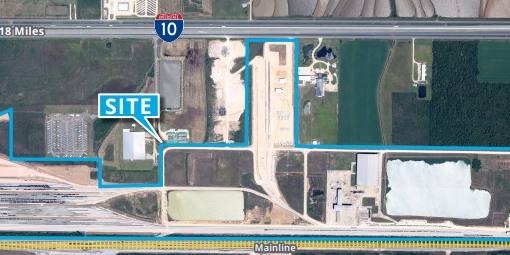
I-10 and LA 101 Iowa, LA 70647
I-10 and LA 101 Iowa, LA 70647
Details & Description
Property Highlights
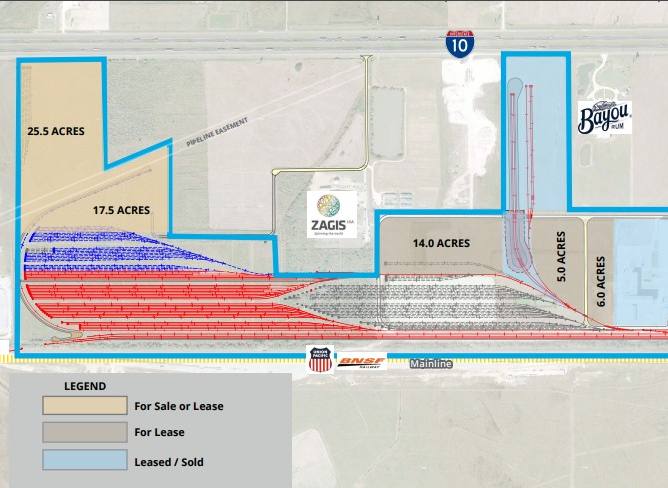
- • Up to 100 Acres Available for Build-to-Suit
- • Unit train capable facility
- • Natural Gas and Electric Service On-Site
- • Close Proximity to Port of Lake Charles
- • High Capacity Natural Gas Pipeline Access
- • Heavy Haul Access via I-10
Listing Agents

Robert Alinger
O: 713-830-2167
M: 713-724-7208
robert.alinger@colliers.com
O: 713-830-2167
M: 713-724-7208
robert.alinger@colliers.com

Wes Williams
O: 713-830-2113
M: 281-636-9535
wes.williams@colliers.com
O: 713-830-2113
M: 281-636-9535
wes.williams@colliers.com
While we strive to provide the most accurate information, all listing information, and demographic data, is provided by third-parties. As such, MyEListing will not be responsible for the accuracy of the information. It is strongly recommended that you verify all information with the listing agent, and any relevant agencies, prior to making any decisions.