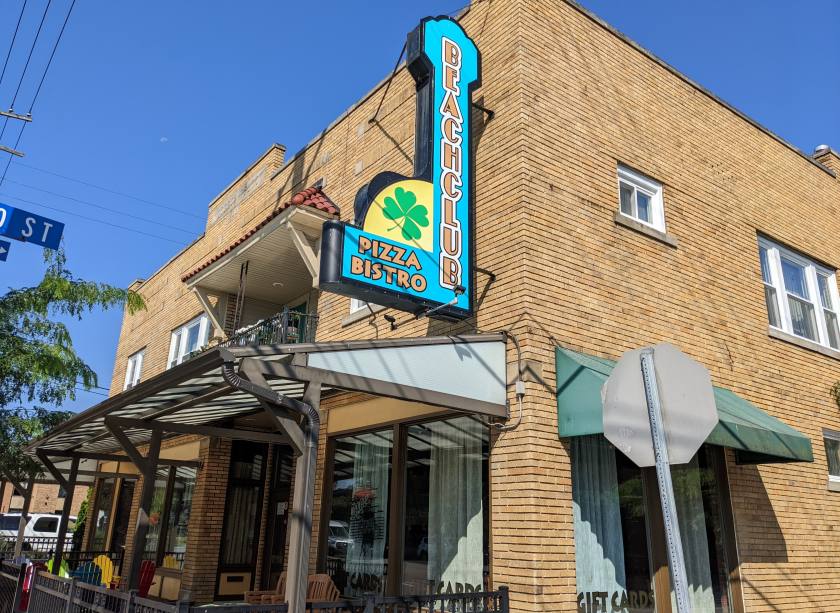
Retail Space
21939 Lakeshore Boulevard Euclid, OH 44123
21939 Lakeshore Boulevard Euclid, OH 44123
Details & Description
Property Highlights
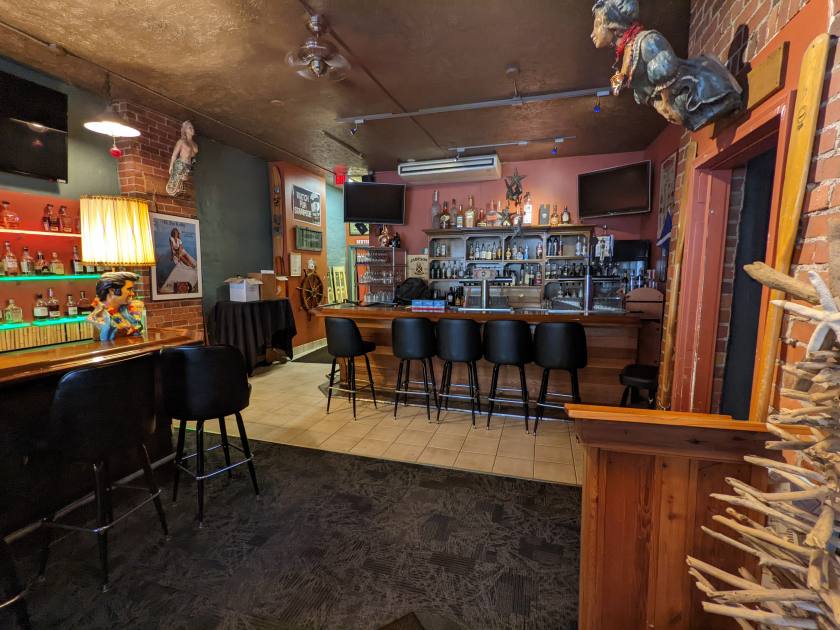
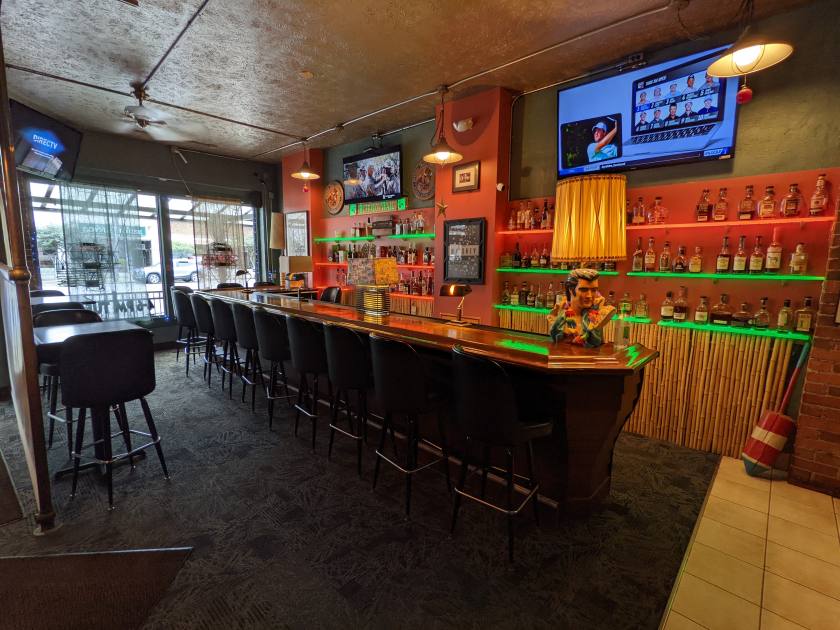
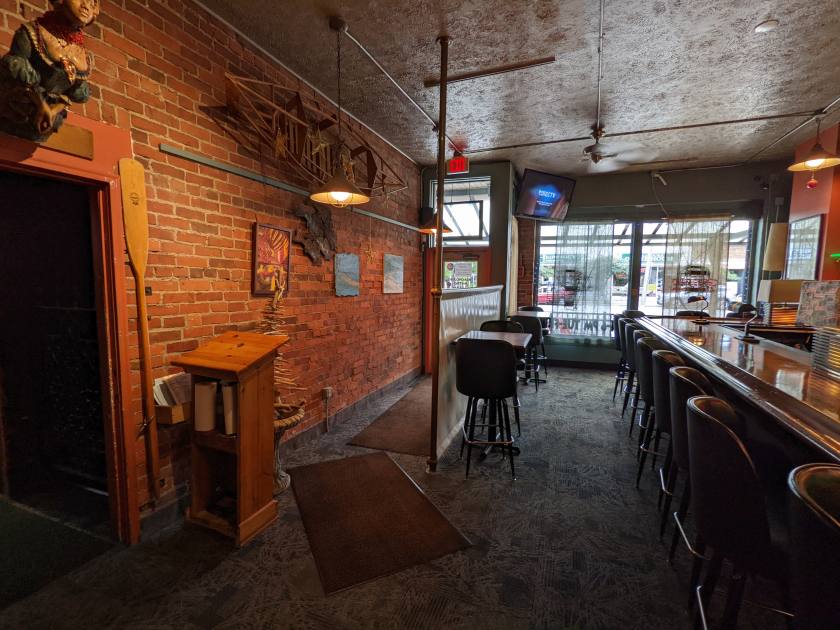
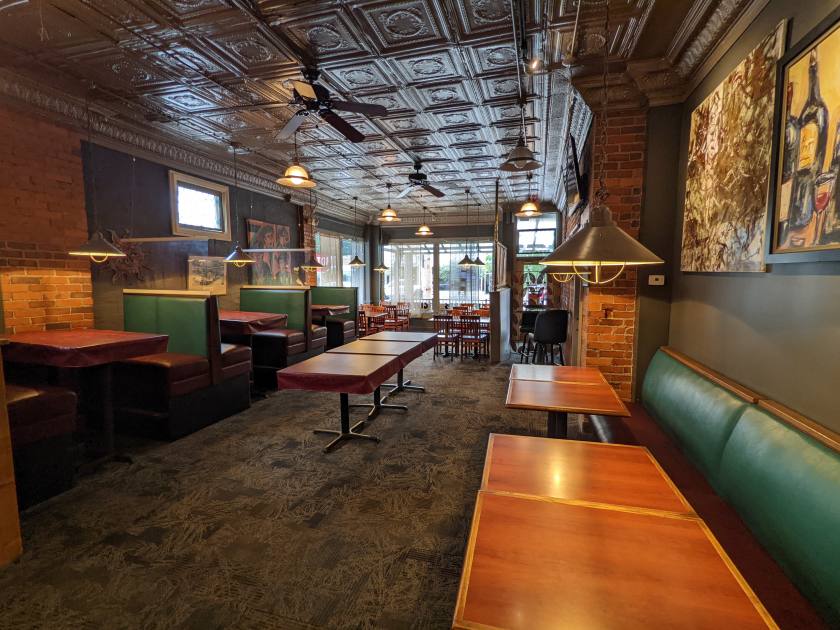
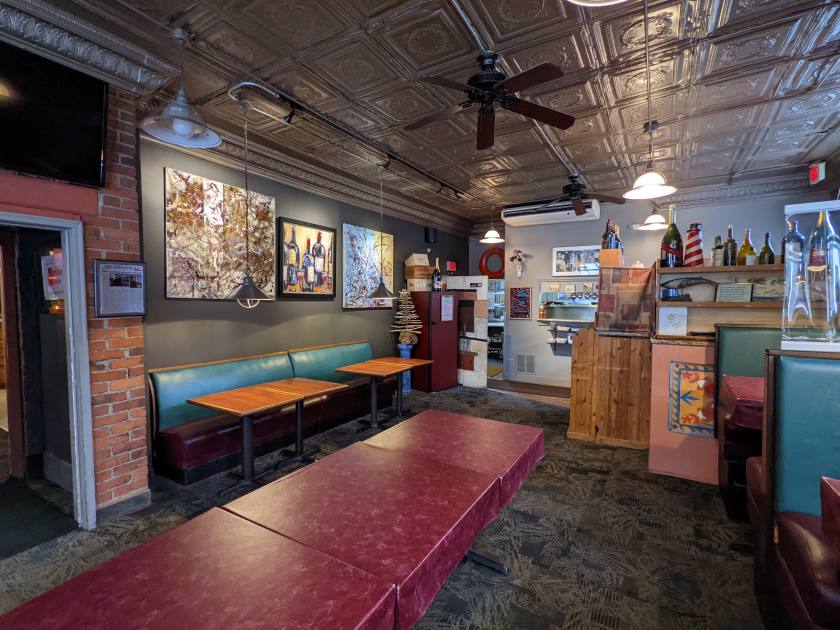
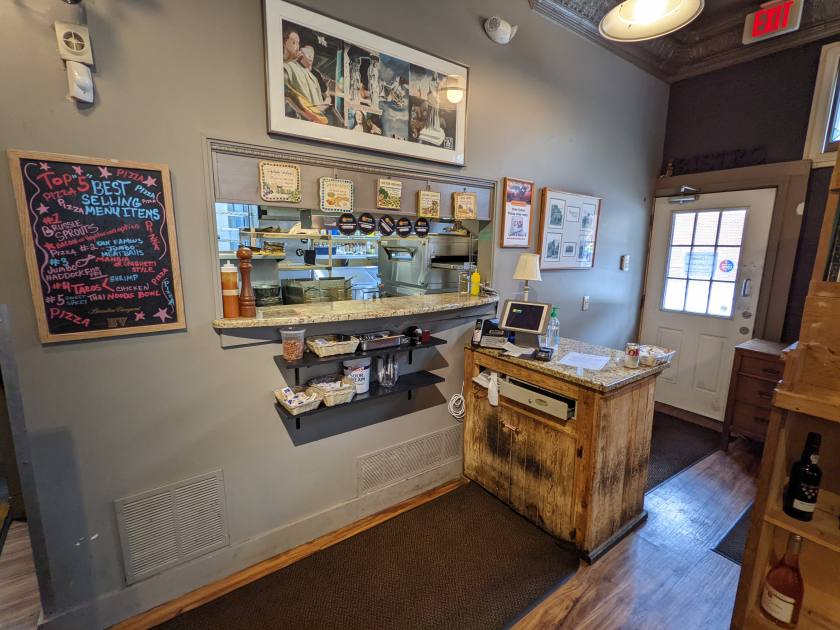
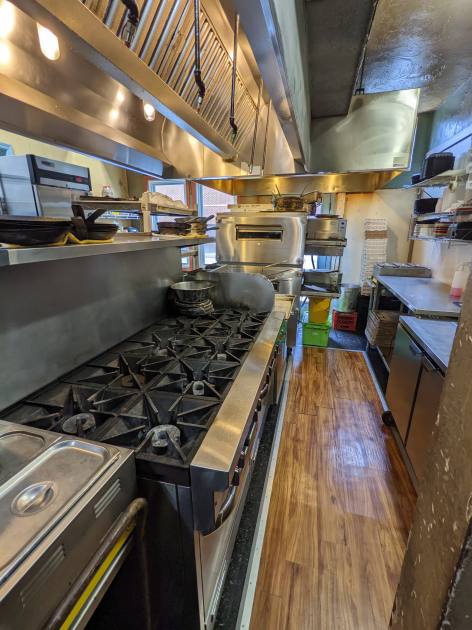
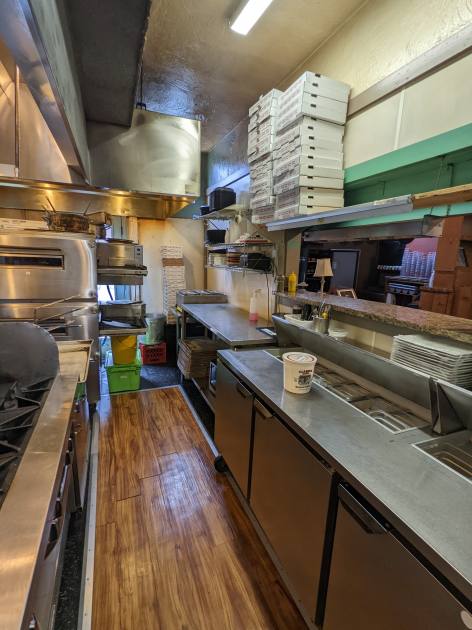
- • 3,201 SF restaurant space ready to be occupied
- • D5/D6 Liquor License Included
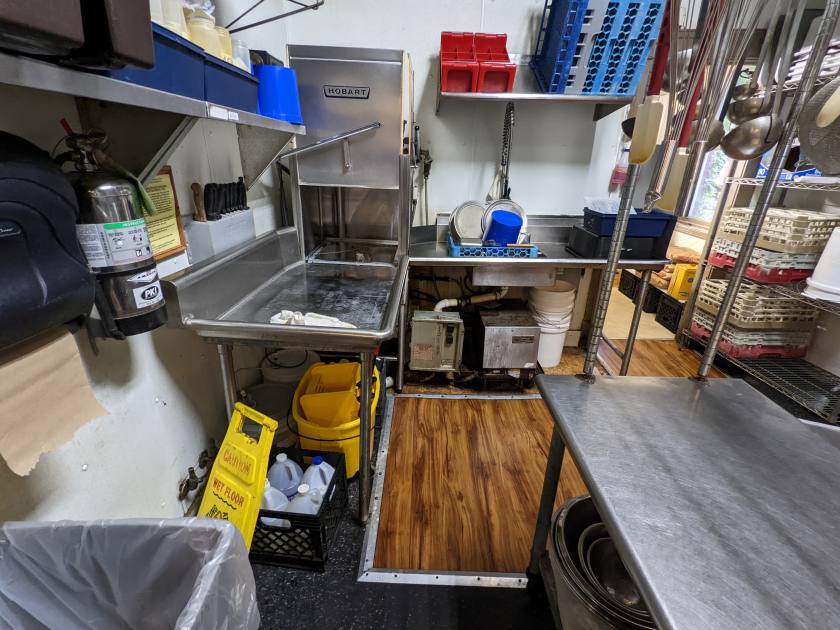
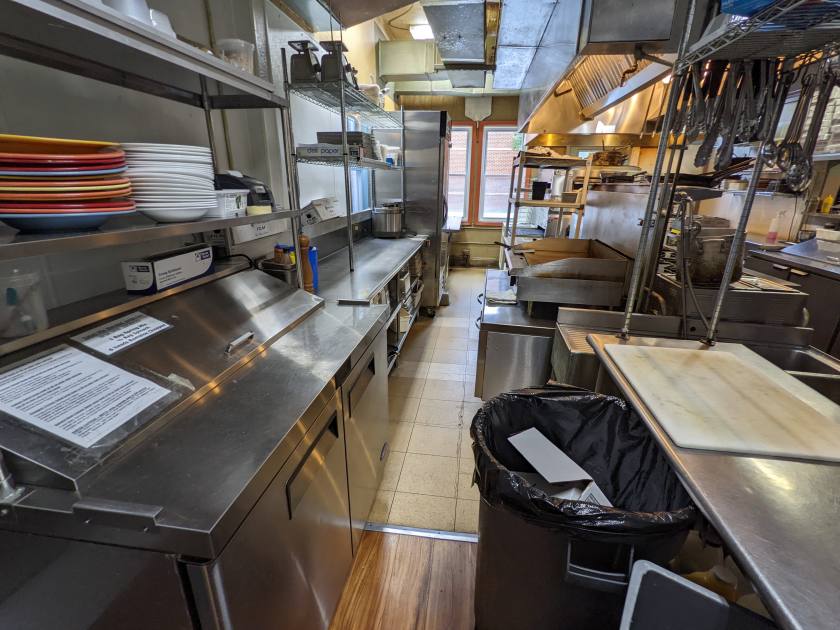
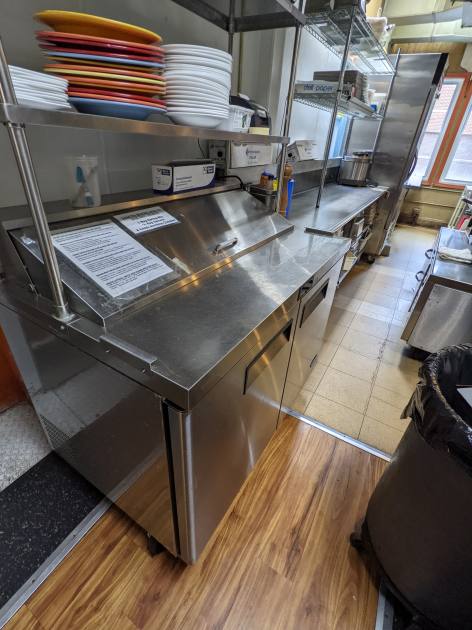
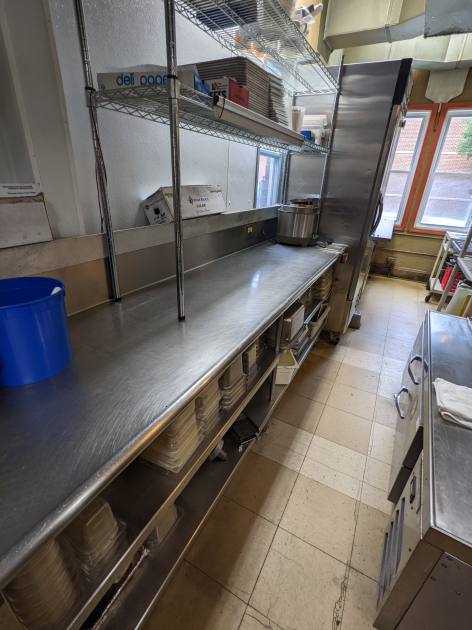
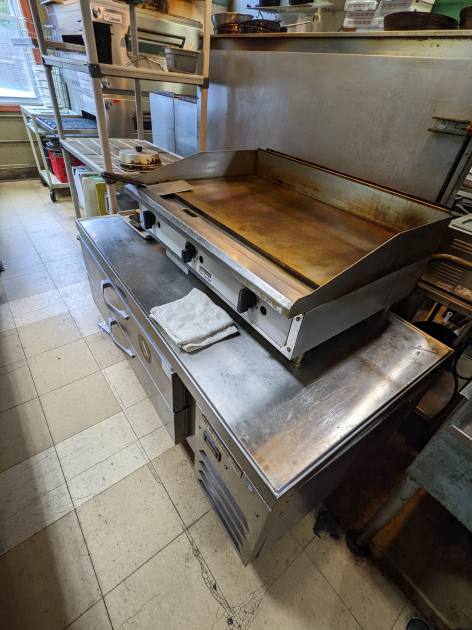
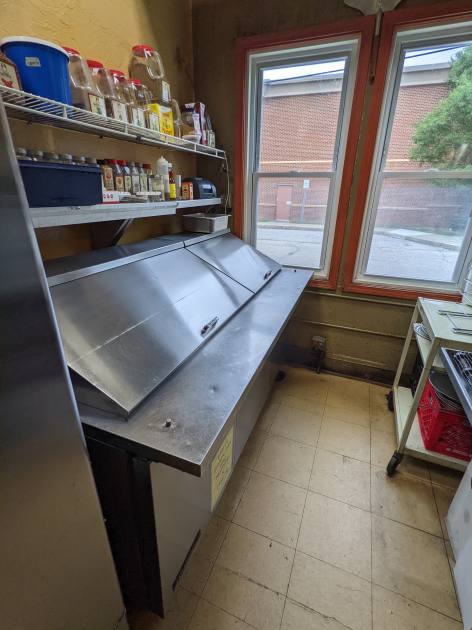
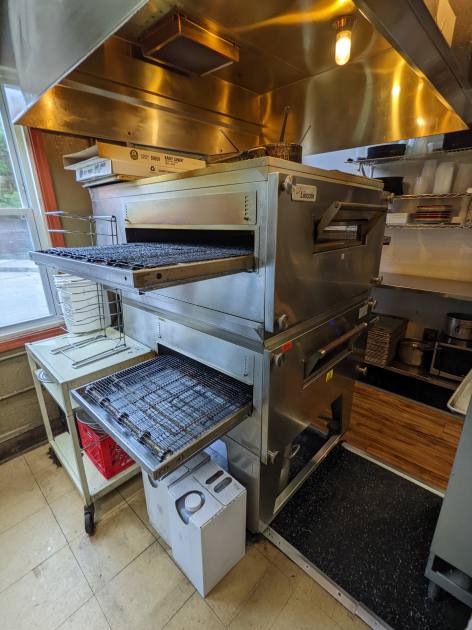
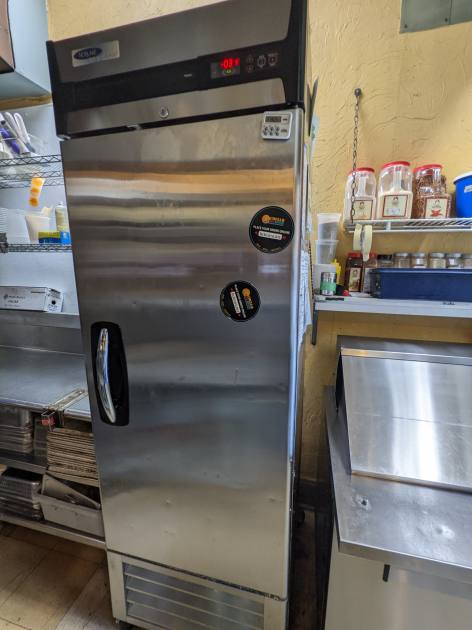
- • All restaurant fixtures, furniture, and equipment
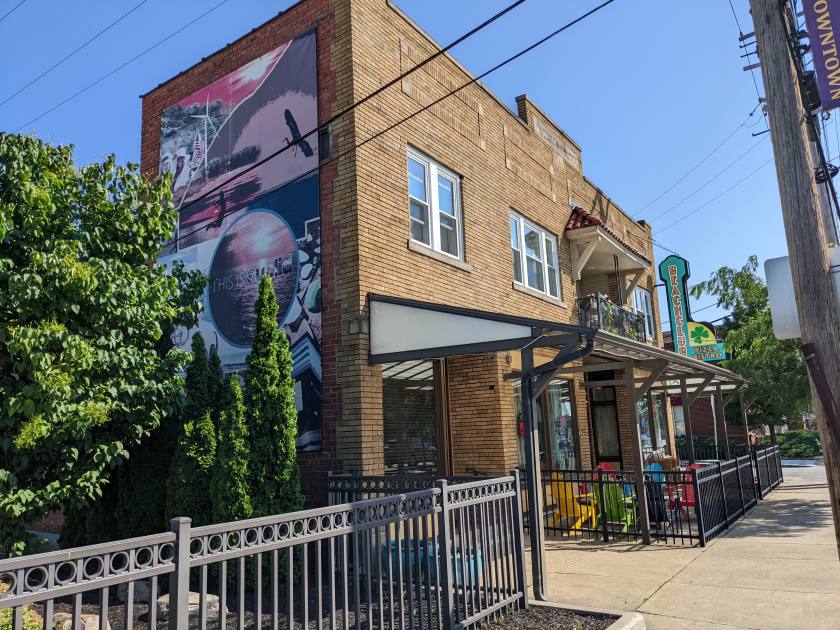
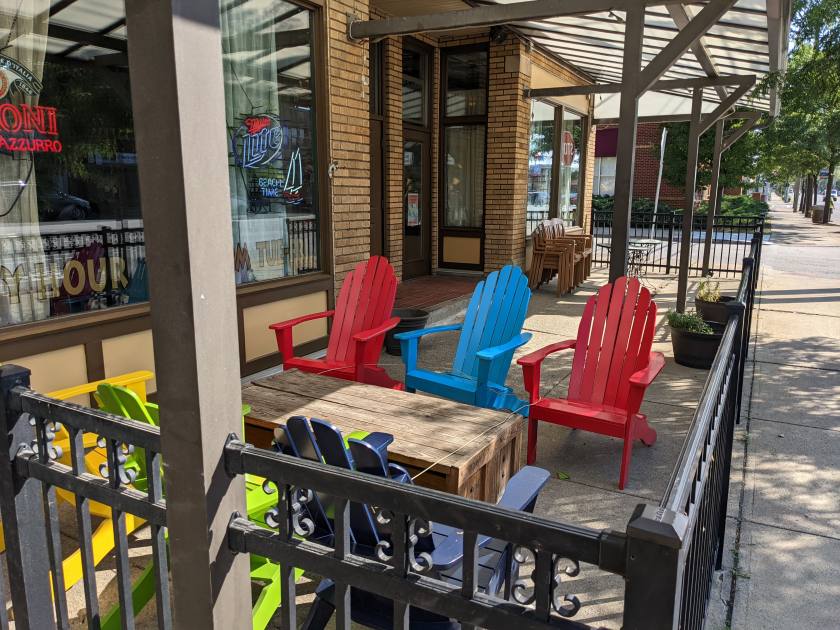
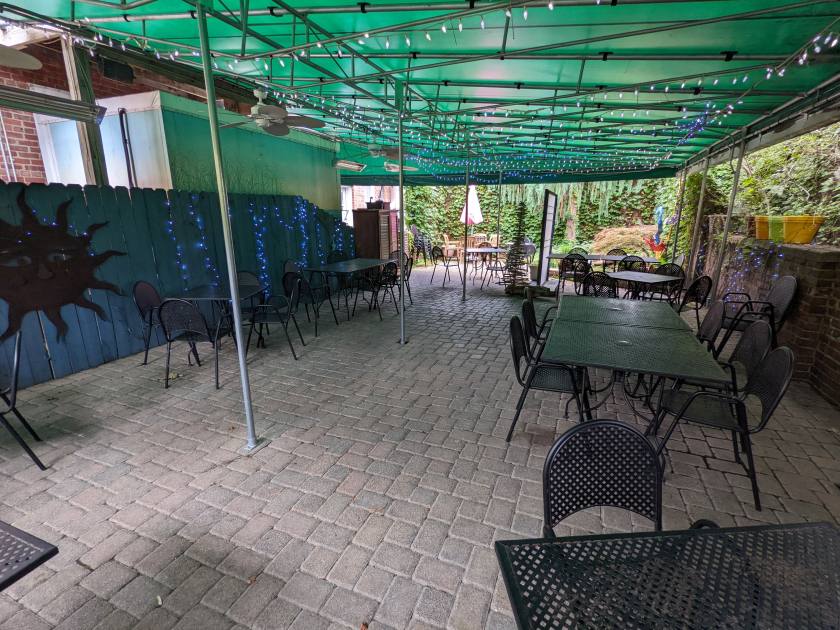
Additional Photos

Listing Agents

Eric Purcell
O: 216-245-3343
M: 216-702-4066
eric@citiroc.com
O: 216-245-3343
M: 216-702-4066
eric@citiroc.com
While we strive to provide the most accurate information, all listing information, and demographic data, is provided by third-parties. As such, MyEListing will not be responsible for the accuracy of the information. It is strongly recommended that you verify all information with the listing agent, and any relevant agencies, prior to making any decisions.