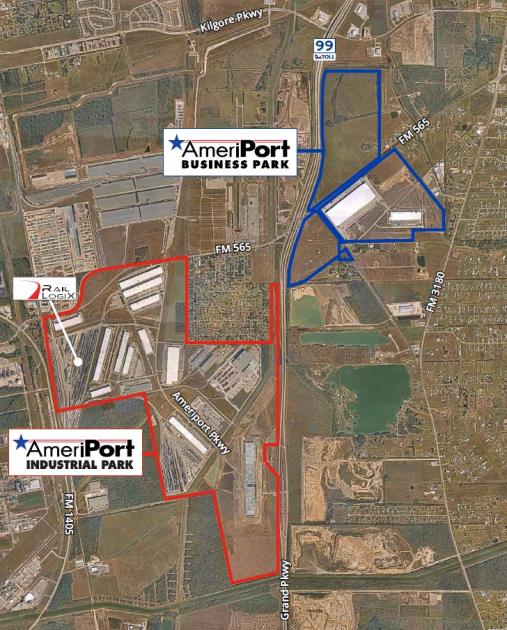
835 acre master planned, deed restricted industrial park
Integrated rail services provided by Rail Logix AmeriPort, LLC
Foreign Trade Zone (FTZ) designation, No. 171
Up to 150 acres available for build-to-suit
Regional detention system – 100% net acreage
Industrial water supply available from coastal water authority
Fiber, natural gas, and 35 KV electric service on-site
Contact an advisor for more information on current availabilities and pricing
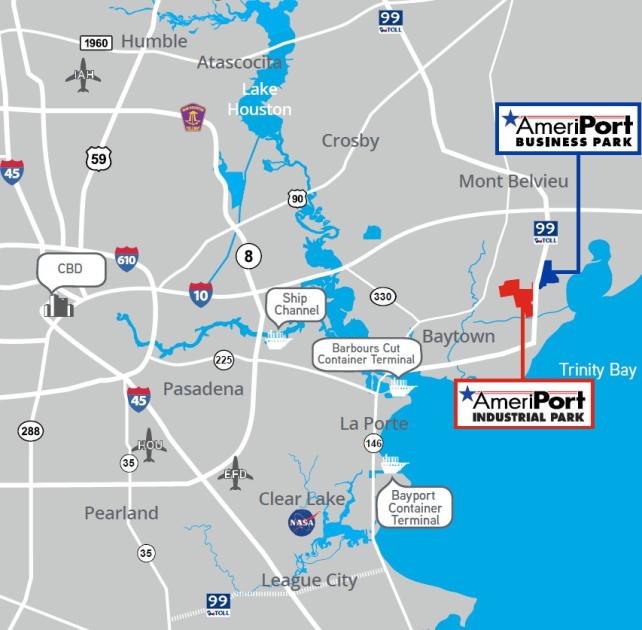
AmeriPort Industrial Park offers an unmatched location with RailLogix connectivity and its close proximity to Barbours Cut and Bayport Container Terminals.
The park features dual rail service with UP and BNSF railway, heavy haul access to I-10 and barge terminals, high capacity natural gas pipeline access, and utilities provided by Chambers County Improvements District #2. The park is located in pro-business Chambers County (Baytown, TX) and is among the lowest operating expenses in the region.
AVAILABILITY
Building 6 (Available March 2025) 298,200 SF
Building 13 (Proposed) 145,860 SF
Building 14 (Available Oct 2024) 133,000 SF
Building 16 (Proposed) 161,700 SF
Building 18 (Proposed) 744,000 SF
Building 20 (Proposed) 603,200 SF
No part of this information may be copied, reproduced, repurposed, or screen-captured for any commercial purpose without prior written authorization from MyEListing.
While we strive to provide the most accurate information, all listing information, and demographic data, is provided by third-parties. As such, MyEListing will not be responsible for the accuracy of the information. It is strongly recommended that you verify all information with the listing agent, and any relevant agencies, prior to making any decisions.
What is the building size of this commercial Industrial property?
The size of this multi-unit property varies between 133000 - 744000 square feet
What kind of Industrial is the propery at Grand Parkway and FM 565?
The property at Grand Parkway and FM 565 Baytown, TX 77523 is listed as a Flex-Office-Warehouse Industrial property
What is the population within 1 mile of Grand Parkway and FM 565 in Baytown?
The population within 1 mile of Grand Parkway and FM 565 Baytown, TX 77523 is 879 people.
Who do I contact for questions about Grand Parkway and FM 565?
You should contact the listing agent,
Robert Alinger, for any details regarding this commercial listing.