Retail Space
2869 Richmond Highway Stafford, VA 22554
2869 Richmond Highway Stafford, VA 22554
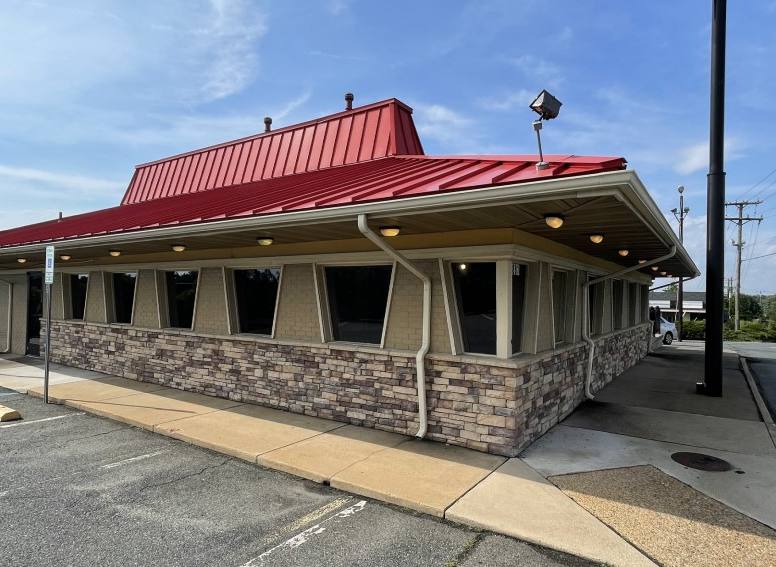
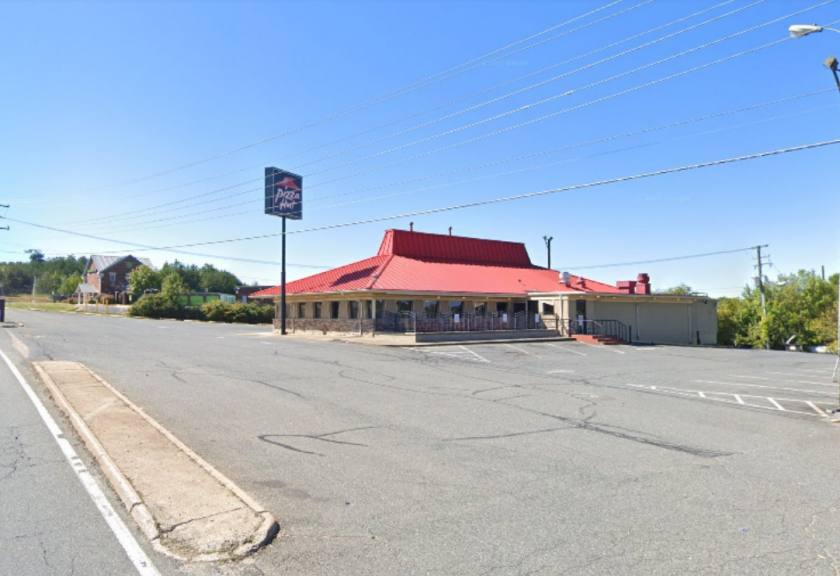
Details & Description
Property Highlights
- • Soon-to-be Vacant Restaurant
- • Building will be dark in October 2022
- • 265 feet of frontage on Richmond Highway
- • High surrounding incomes
- • Major freeway exit
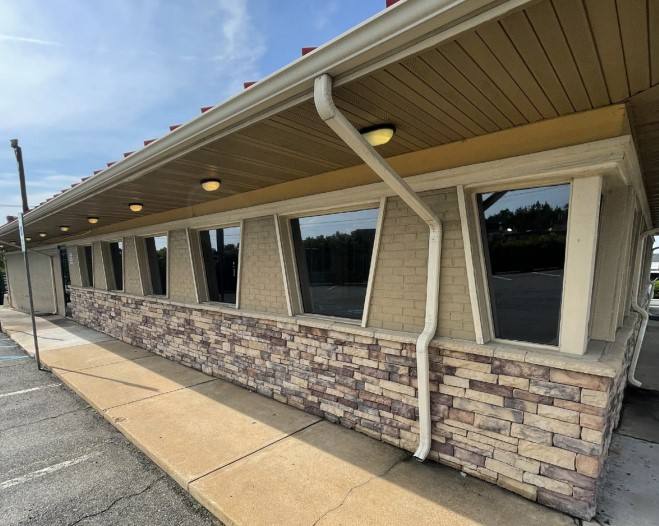
Additional Photos

Listing Agents

Cody Persyn
O: 713-830-2194
M: 832-816-6654
cody.persyn@colliers.com
O: 713-830-2194
M: 832-816-6654
cody.persyn@colliers.com
While we strive to provide the most accurate information, all listing information, and demographic data, is provided by third-parties. As such, MyEListing will not be responsible for the accuracy of the information. It is strongly recommended that you verify all information with the listing agent, and any relevant agencies, prior to making any decisions.


