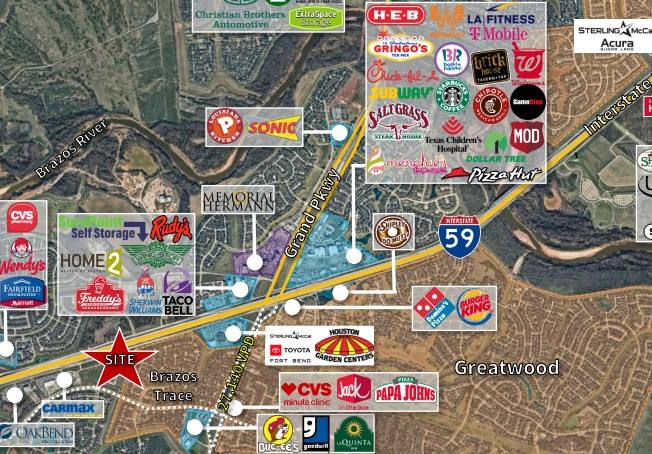
Commercial Land
HWY 59 and SH 99 Richmond, TX 77469
HWY 59 and SH 99 Richmond, TX 77469
Details & Description
Property Highlights
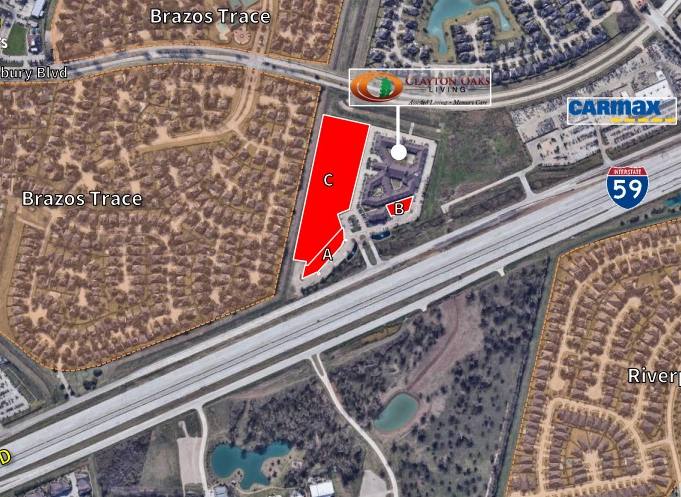
- • Site A: ±2 Acres - $1.3M
- • Site B: ±1 Acre - $1.3M
- • Site C: ±6.106 Acres - $22.00 PSF
- • Utilities - Utilities available to site
- • Detention - Onsite detention required
- • Neighboring Sugar Land and Richmond!
Listing Agents

Barrett Von Blon
O: 713-577-1777
M: 832-563-9996
barrett.vonblon@cbre.com
O: 713-577-1777
M: 832-563-9996
barrett.vonblon@cbre.com

Simmi Jaggi
JLL
O: 713-888-4098
simmi.jaggi@am.jll.com
JLL
O: 713-888-4098
simmi.jaggi@am.jll.com

Elizabeth Clampitt
JLL
O: 713-888-4075
elizabeth.clampitt@am.jll.com
JLL
O: 713-888-4075
elizabeth.clampitt@am.jll.com
While we strive to provide the most accurate information, all listing information, and demographic data, is provided by third-parties. As such, MyEListing will not be responsible for the accuracy of the information. It is strongly recommended that you verify all information with the listing agent, and any relevant agencies, prior to making any decisions.