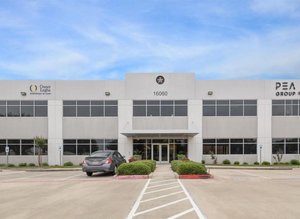
1-Mile | 3-Miles | 5-Miles | ||
---|---|---|---|---|
Total Population | 6,460 | 16,578 | 21,149 | |
Population Median Age | 39 | 39 | 40 | |
Population by Age | 0-9 Yrs | 919 (14%) | 2168 (13%) | 2608 (12%) |
10-19 Yrs | 1014 (15%) | 2739 (16%) | 3408 (16%) | |
20-29 Yrs | 1003 (15%) | 2103 (12%) | 2608 (12%) | |
30-39 Yrs | 611 (9%) | 1684 (10%) | 2076 (9%) | |
40-49 Yrs | 479 (7%) | 1635 (9%) | 2271 (10%) | |
50-59 Yrs | 591 (9%) | 1703 (10%) | 2372 (11%) | |
60-69 Yrs | 734 (11%) | 1915 (11%) | 2594 (12%) | |
70+ Yrs | 1108 (17%) | 2632 (15%) | 3212 (15%) | |
Median HH Income | $49,737 | $50,819 | $54,208 | |
Total Household Income | < 24K | 525 (20%) | 1404 (23%) | 1630 (21%) |
25-49K | 735 (29%) | 1580 (26%) | 1955 (25%) | |
50-74K | 605 (24%) | 1282 (21%) | 1628 (21%) | |
75-99K | 308 (12%) | 589 (9%) | 788 (10%) | |
100-199K | 240 (9%) | 885 (14%) | 1203 (15%) | |
200K+ | 101 (4%) | 311 (5%) | 516 (6%) | |
Highest Education Level | No Diploma | 452 | 1573 | 2012 |
Diploma or GED | 966 | 2886 | 3759 | |
Some College | 845 | 2199 | 2786 | |
Assoc. Degree | 253 | 873 | 1133 | |
Bachelors Degree | 962 | 1898 | 2617 | |
Higher Degree | 532 | 998 | 1269 | |
Total Housing Units | 2,838 | 6,803 | 8,651 | |
--Owner-Occupied | 1,473 | 3,763 | 5,095 | |
--Renter-Occupied | 1,042 | 2,288 | 2,625 | |
Owner-Occupied Values | < 100K | 134 | 559 | 764 |
100-199K | 841 | 2015 | 2341 | |
200-299K | 376 | 678 | 920 | |
300-399K | 95 | 344 | 608 | |
400-499K | 1 | 46 | 136 | |
500K+ | 25 | 122 | 326 | |
Total Working Age Population | 5,315 | 13,462 | 17,280 | |
In Work Force | 3,014 | 7,300 | 9,691 | |
Not In Work Force | 2,301 | 6,161 | 7,588 | |
Workforce Employed | 2,832 | 6,937 | 9,267 | |
Workforce Unemployed | 182 | 364 | 425 | |
Civlian Workforce | 3,014 | 7,300 | 9,691 | |
Military Workforce | 0 | 0 | 0 | |
Total Households | 2,515 | 6,051 | 7,720 | |
Family Households | 1,337 | 3,619 | 4,816 | |
Non-Family Households | 1,178 | 2,432 | 2,904 | |
Married Couple | 1,106 | 2,671 | 3,667 | |
Other Family | 231 | 948 | 1,149 | |
Married w/Child | 371 | 945 | 1,282 | |
Single Male w/Child | 14 | 92 | 117 | |
Single Female w/Child | 97 | 309 | 358 |
Population Change Last Two Decades - Plus Projection
2000 | % | 2010 | % | 2020 | % | 2030 | |
---|---|---|---|---|---|---|---|
Texas | 20,851,820 | +21 | 25,145,561 | +18 | 29,677,668 | +18 | 34,894,452 |
Washington County | 30,373 | +11 | 33,718 | +4 | 35,155 | +3 | 36,135 |
Austin County | 23,590 | +20 | 28,417 | +7 | 30,402 | +5 | 32,046 |
Total Working Age Population:
Total Households:
Total Working Age Population:
Total Households:
Total Working Age Population:
Total Households: