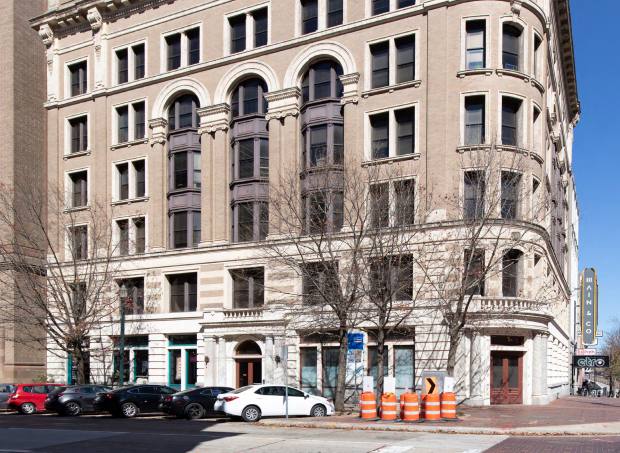
1-Mile | 3-Miles | 5-Miles | ||
---|---|---|---|---|
Total Population | 19,602 | 165,118 | 393,030 | |
Population Median Age | 37 | 37 | 37 | |
Population by Age | 0-9 Yrs | 682 (3%) | 15149 (9%) | 41266 (10%) |
10-19 Yrs | 934 (4%) | 12524 (7%) | 36531 (9%) | |
20-29 Yrs | 5449 (27%) | 38358 (23%) | 81682 (20%) | |
30-39 Yrs | 5113 (26%) | 35807 (21%) | 74595 (18%) | |
40-49 Yrs | 3118 (15%) | 21136 (12%) | 47509 (12%) | |
50-59 Yrs | 2616 (13%) | 18037 (10%) | 44847 (11%) | |
60-69 Yrs | 1140 (5%) | 14545 (8%) | 37649 (9%) | |
70+ Yrs | 550 (2%) | 9562 (5%) | 28951 (7%) | |
Median HH Income | $87,569 | $70,895 | $70,474 | |
Total Household Income | < 24K | 1227 (19%) | 15223 (20%) | 34441 (20%) |
25-49K | 557 (9%) | 12160 (16%) | 28786 (17%) | |
50-74K | 901 (14%) | 11419 (15%) | 24442 (14%) | |
75-99K | 792 (12%) | 8140 (10%) | 16884 (10%) | |
100-199K | 1463 (23%) | 16271 (21%) | 35231 (21%) | |
200K+ | 1226 (19%) | 11085 (14%) | 27540 (16%) | |
Highest Education Level | No Diploma | 2770 | 18470 | 45686 |
Diploma or GED | 4164 | 19916 | 46891 | |
Some College | 2815 | 17658 | 38321 | |
Assoc. Degree | 632 | 5606 | 11866 | |
Bachelors Degree | 3272 | 34422 | 74686 | |
Higher Degree | 2156 | 26558 | 63410 | |
Total Housing Units | 7,442 | 85,738 | 191,663 | |
--Owner-Occupied | 1,401 | 29,164 | 77,033 | |
--Renter-Occupied | 4,765 | 45,133 | 90,291 | |
Owner-Occupied Values | < 100K | 83 | 3431 | 12336 |
100-199K | 166 | 4686 | 12375 | |
200-299K | 317 | 4654 | 9432 | |
300-399K | 328 | 5120 | 12205 | |
400-499K | 236 | 3445 | 8732 | |
500K+ | 271 | 7828 | 21953 | |
Total Working Age Population | 18,645 | 143,016 | 332,054 | |
In Work Force | 7,855 | 97,978 | 220,564 | |
Not In Work Force | 10,790 | 45,038 | 111,490 | |
Workforce Employed | 7,365 | 92,618 | 208,798 | |
Workforce Unemployed | 413 | 5,262 | 11,555 | |
Civlian Workforce | 7,778 | 97,880 | 220,354 | |
Military Workforce | 77 | 98 | 211 | |
Total Households | 6,166 | 74,297 | 167,325 | |
Family Households | 1,864 | 30,745 | 81,188 | |
Non-Family Households | 4,302 | 43,552 | 86,137 | |
Married Couple | 1,323 | 21,121 | 55,938 | |
Other Family | 541 | 9,624 | 25,250 | |
Married w/Child | 238 | 6,662 | 18,710 | |
Single Male w/Child | 11 | 905 | 2,805 | |
Single Female w/Child | 194 | 3,253 | 8,150 |
Population Change Last Two Decades - Plus Projection
2000 | % | 2010 | % | 2020 | % | 2030 | |
---|---|---|---|---|---|---|---|
Texas | 20,851,820 | +21 | 25,145,561 | +18 | 29,677,668 | +18 | 34,894,452 |
Harris County | 3,400,578 | +20 | 4,092,459 | +22 | 4,978,845 | +19 | 5,924,750 |
Total Working Age Population:
Total Households:
Total Working Age Population:
Total Households:
Total Working Age Population:
Total Households: