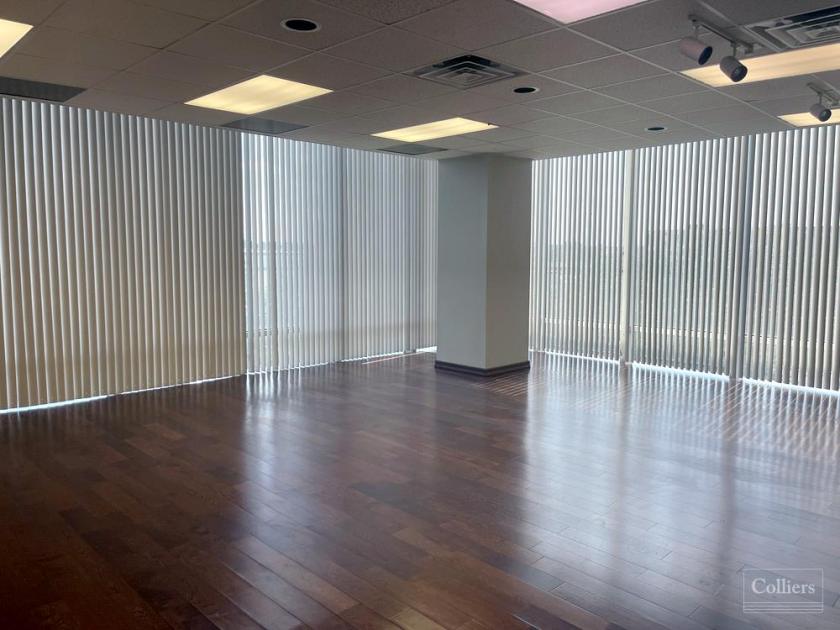
Office Space
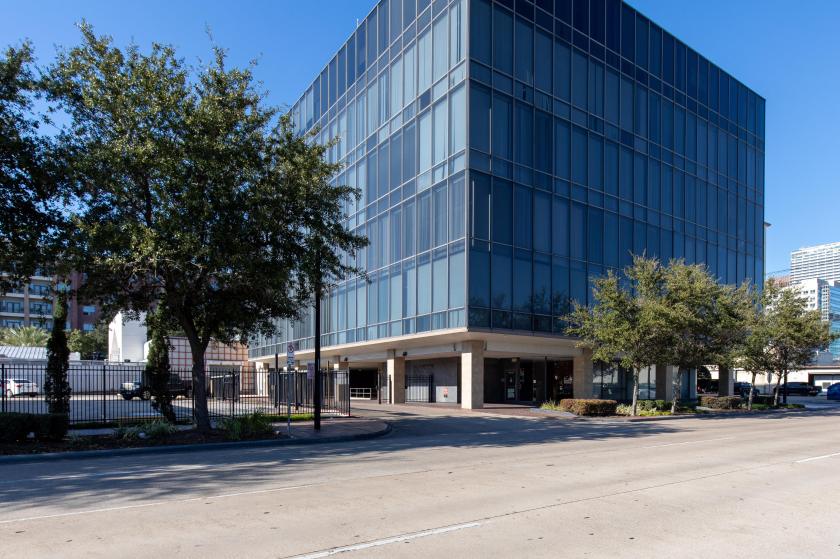
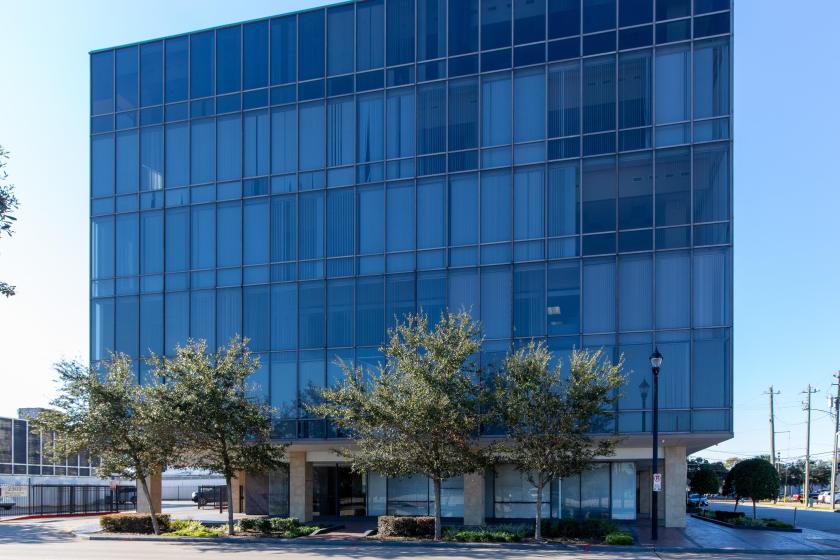
2302 Fannin Street Houston, TX 77002
2302 Fannin Street Houston, TX 77002

Details & Description
Property Highlights
- • Former University of Houston space available
- • Controlled access
- • On-site owner, manager
- • On-site engineer
- • Gated evening security
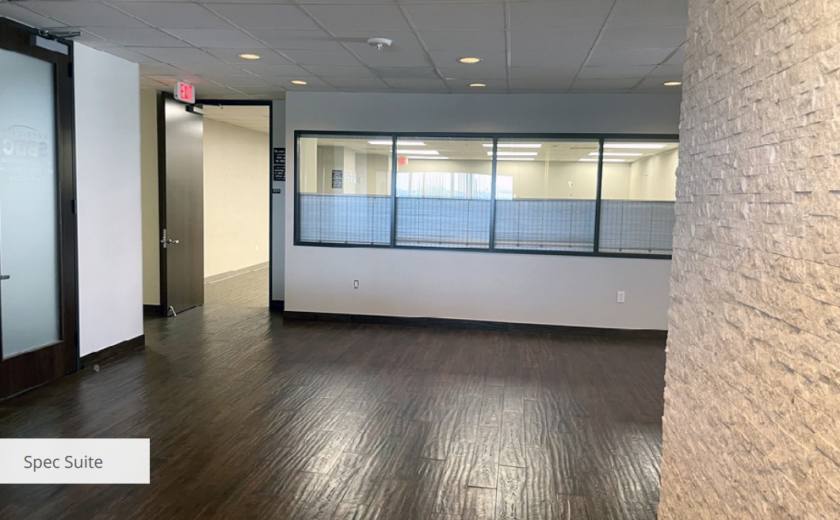
Additional Photos

Listing Agents

Douglas Pack
O: 713-835-0041
M: 713-818-5782
doug.pack@colliers.com
O: 713-835-0041
M: 713-818-5782
doug.pack@colliers.com
While we strive to provide the most accurate information, all listing information, and demographic data, is provided by third-parties. As such, MyEListing will not be responsible for the accuracy of the information. It is strongly recommended that you verify all information with the listing agent, and any relevant agencies, prior to making any decisions.