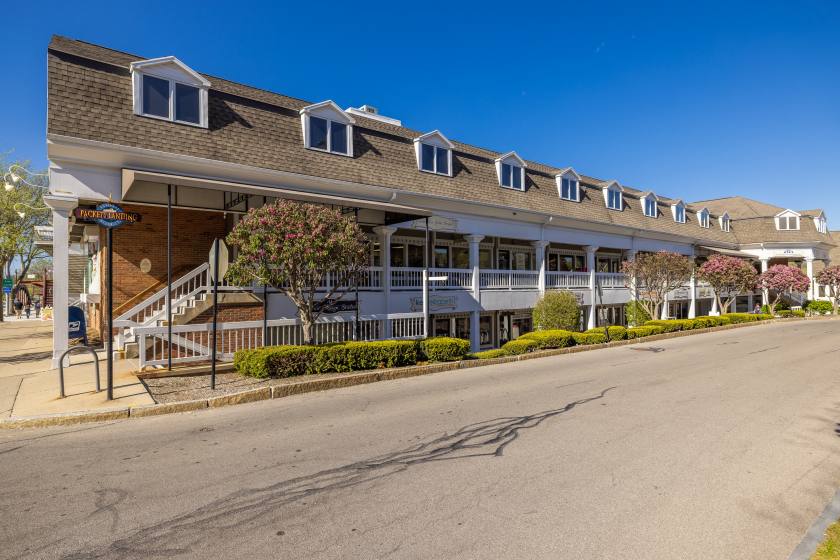
Retail Space
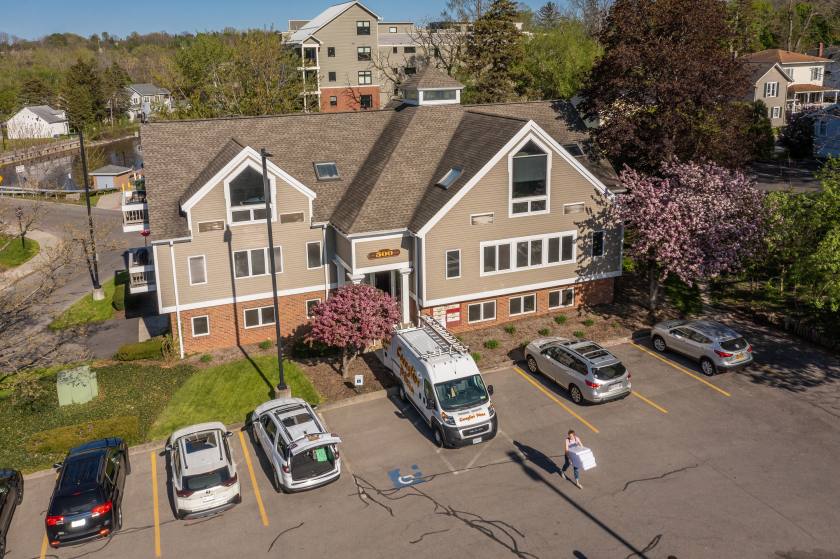
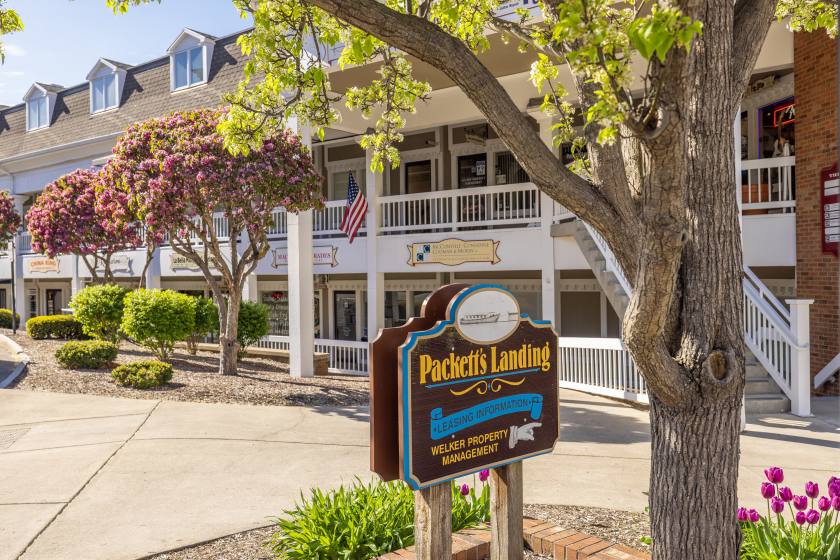
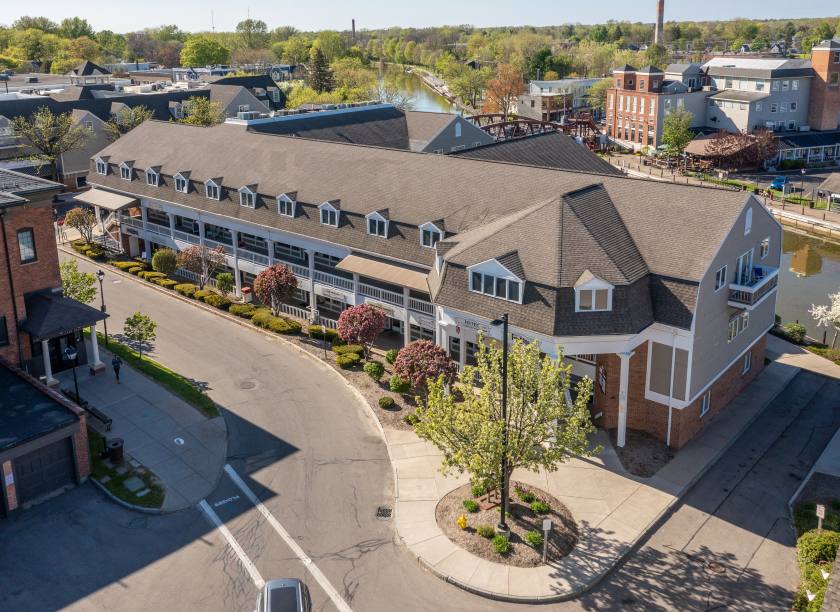
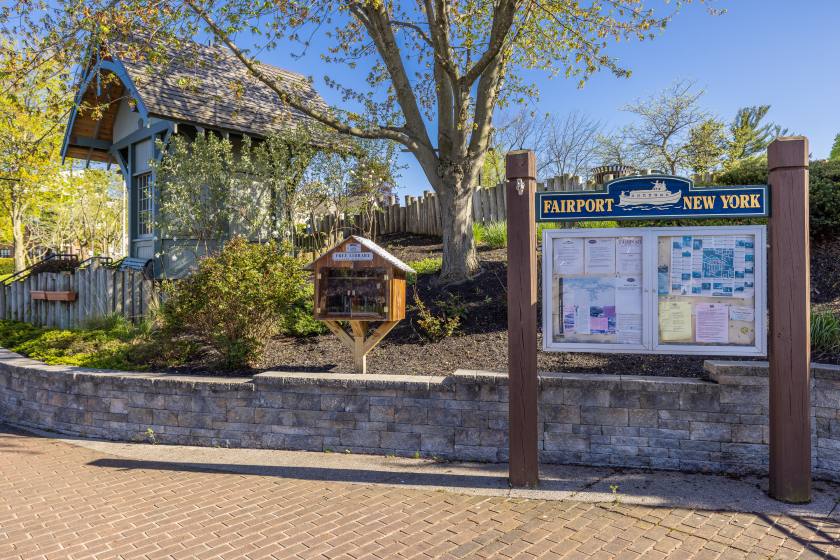
300 Packetts Landing Fairport, NY 14450
300 Packetts Landing Fairport, NY 14450
Details & Description
Property Highlights
- • Shopping & dining within walking distance
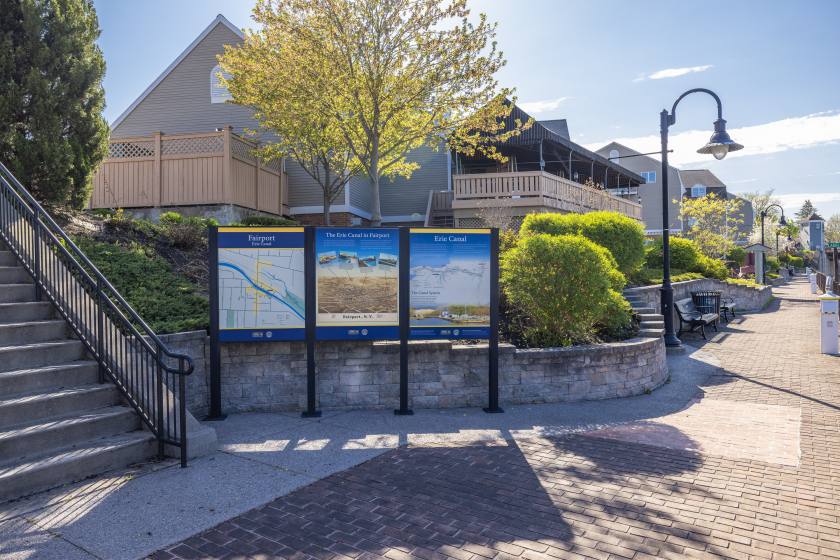
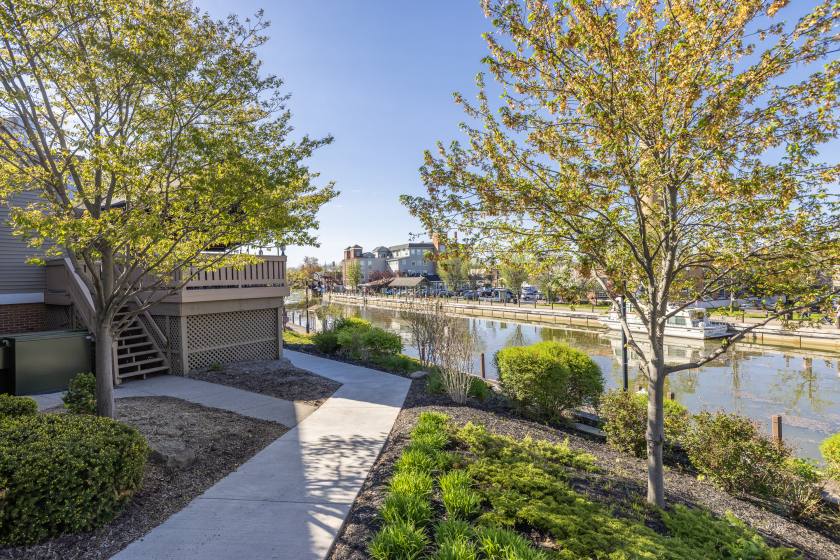
- • Canal Park directly adjacent to buildings
- • Fairport Electric (municipal power)
- • FREE On-Site Parking
- • Seasonal Boat Docking Nearby
Additional Photos

Listing Agents

Michael Conroy
O: 585-735-7739
M: 585-802-3327
michael.conroy@expcommercial.com
O: 585-735-7739
M: 585-802-3327
michael.conroy@expcommercial.com
While we strive to provide the most accurate information, all listing information, and demographic data, is provided by third-parties. As such, MyEListing will not be responsible for the accuracy of the information. It is strongly recommended that you verify all information with the listing agent, and any relevant agencies, prior to making any decisions.