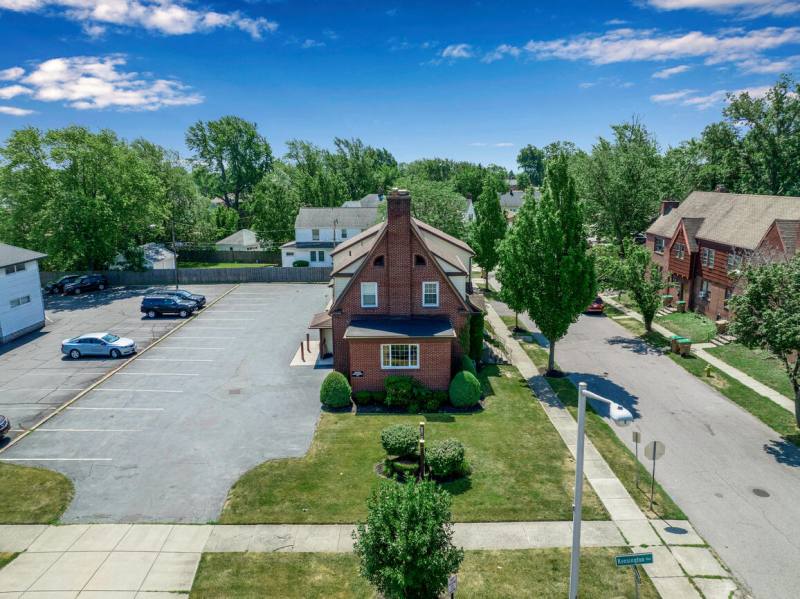
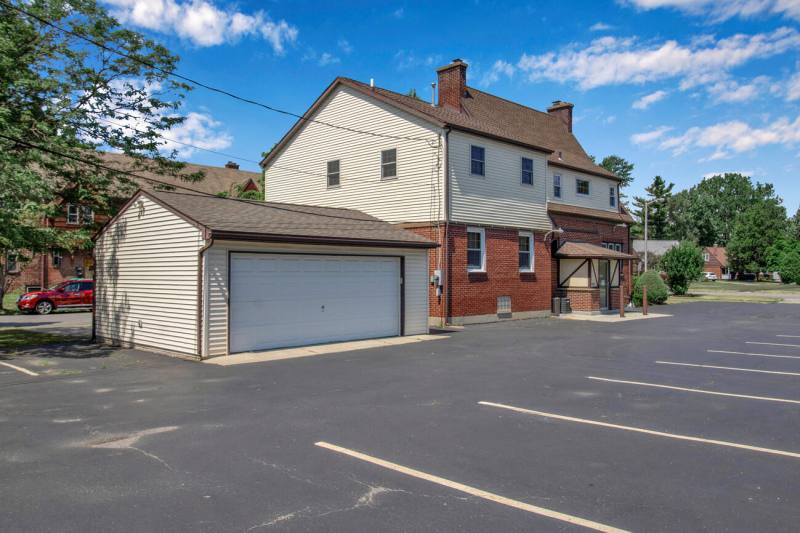
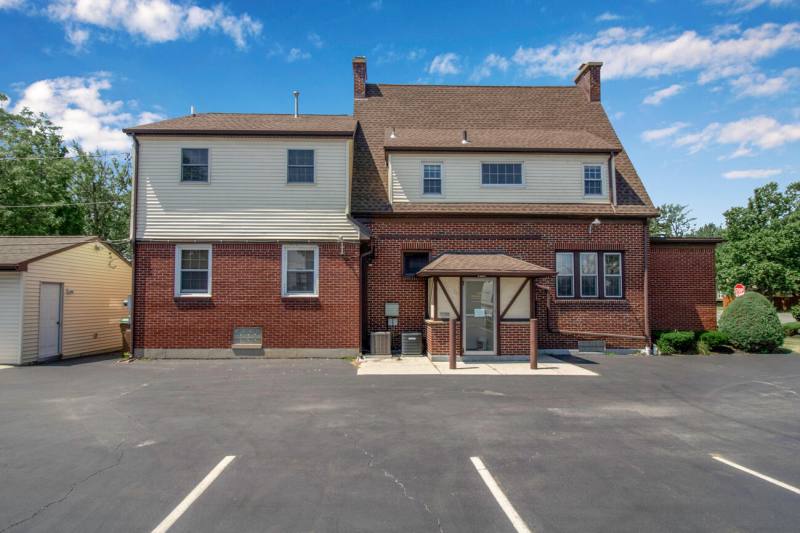
Office Space
1925 Kensington Avenue Cheektowaga, NY 14215
1925 Kensington Avenue Cheektowaga, NY 14215
Details & Description
Property Highlights
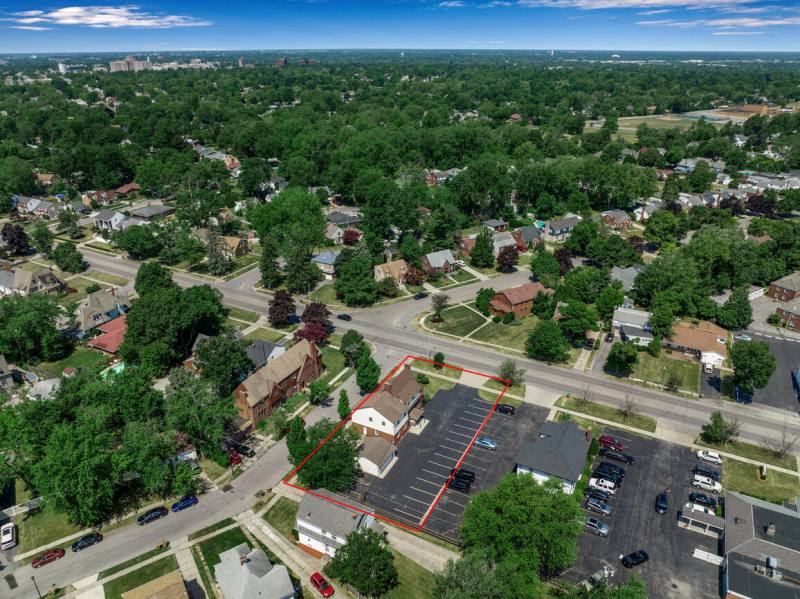
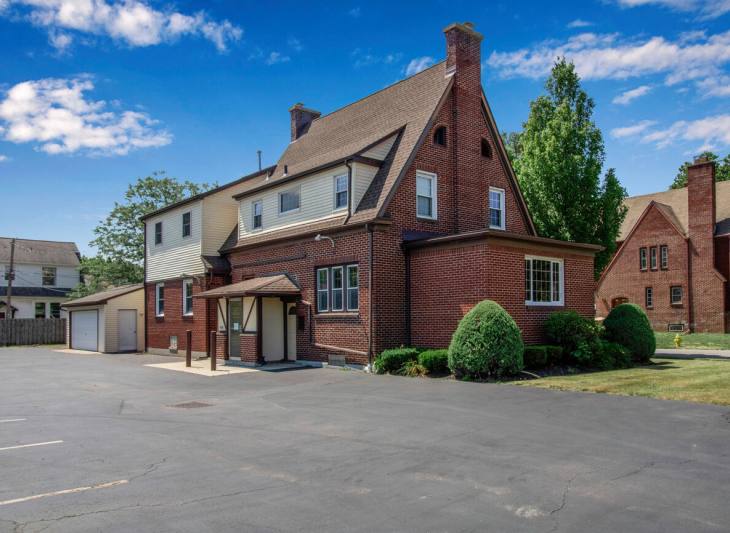
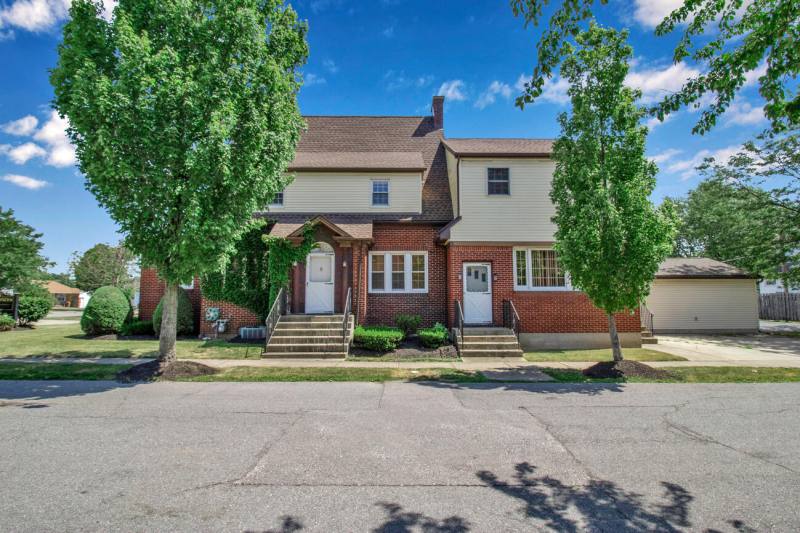
• Minutes from the Buffalo Niagara Airport and Downtown Buffalo
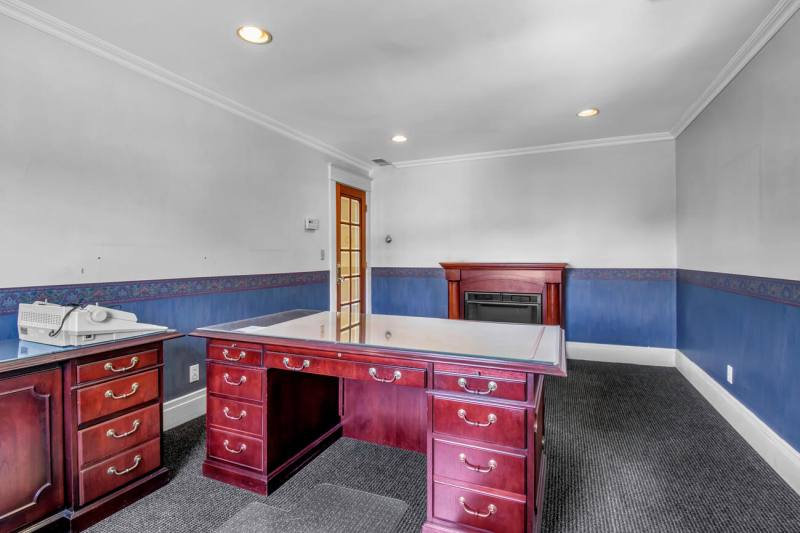
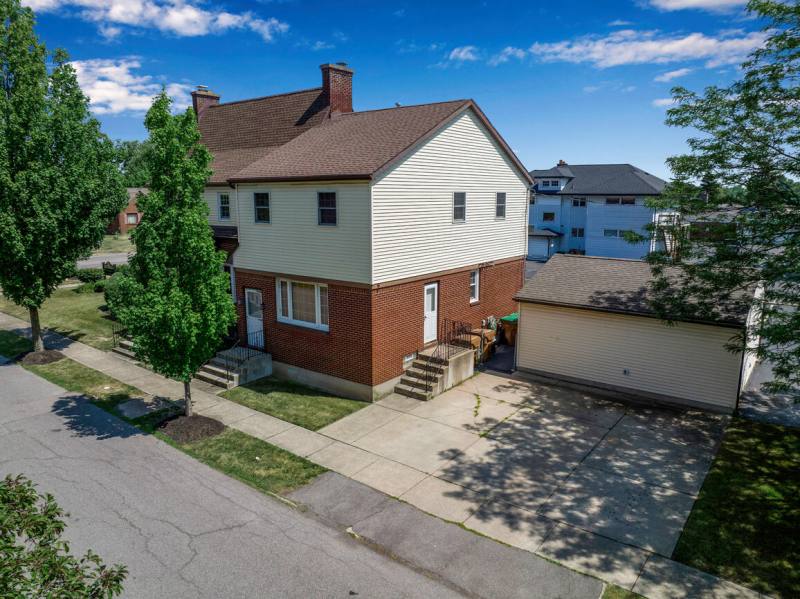
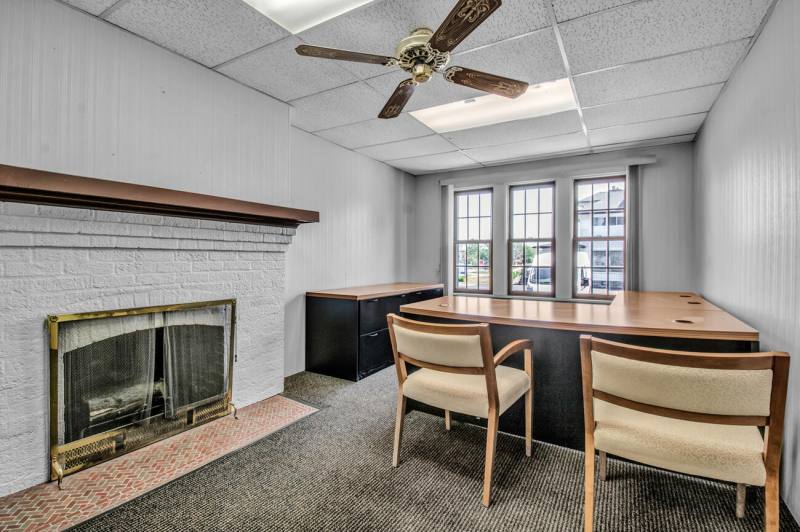
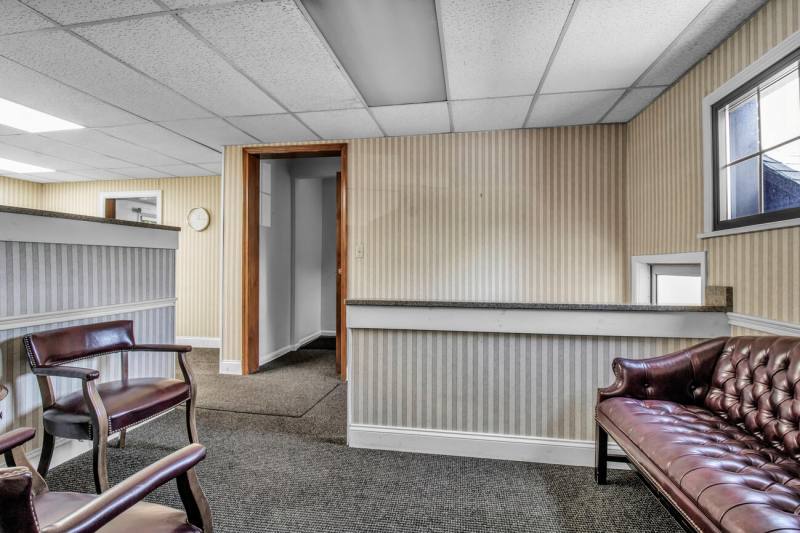
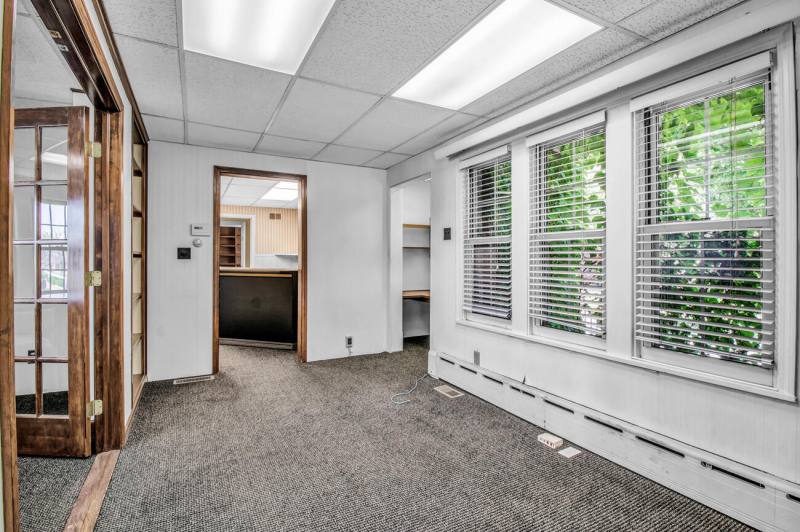
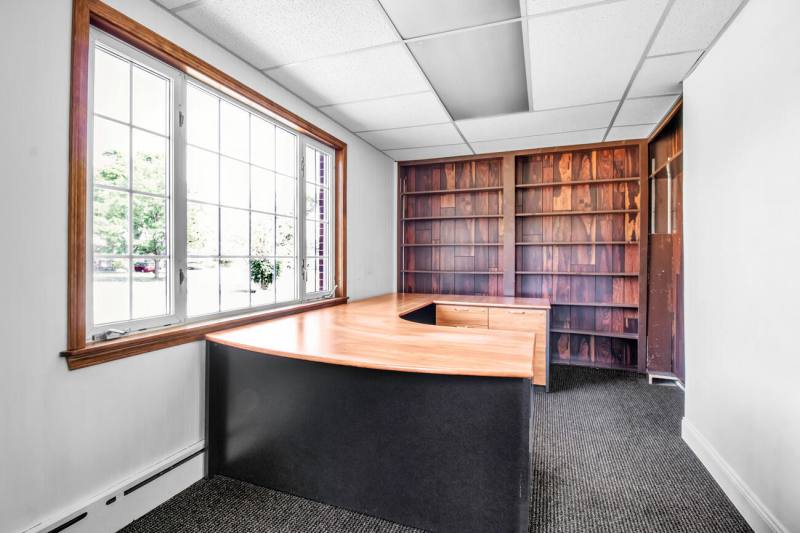
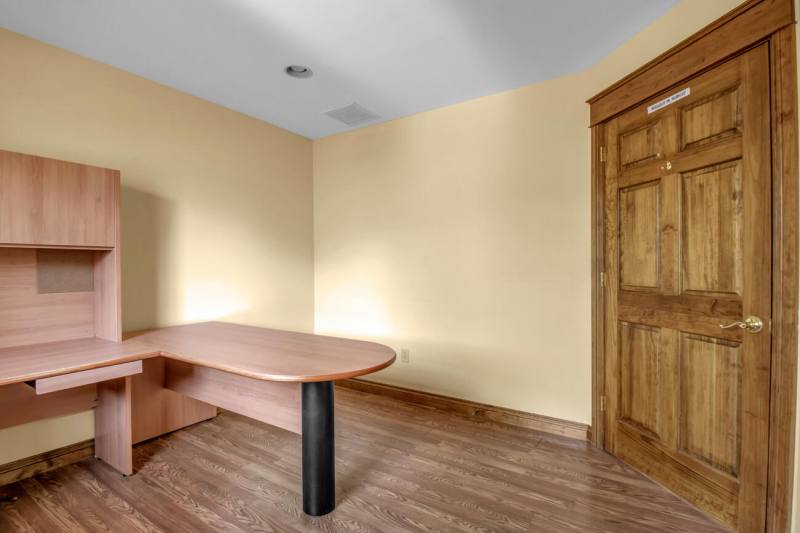
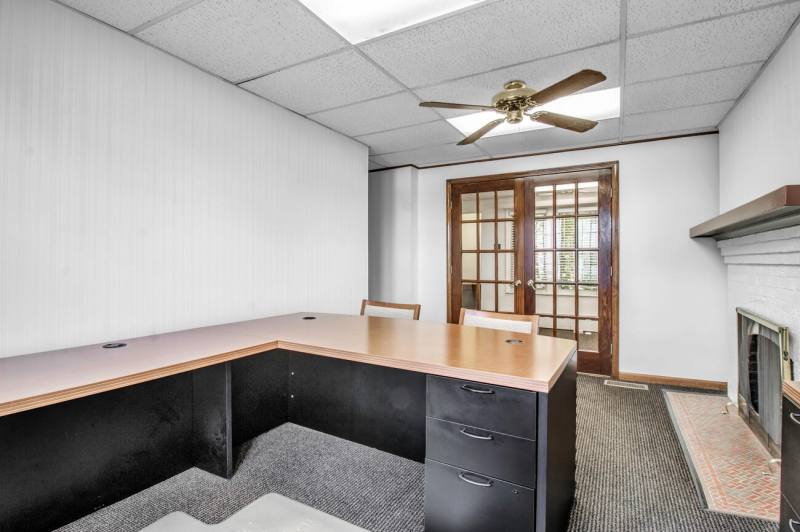
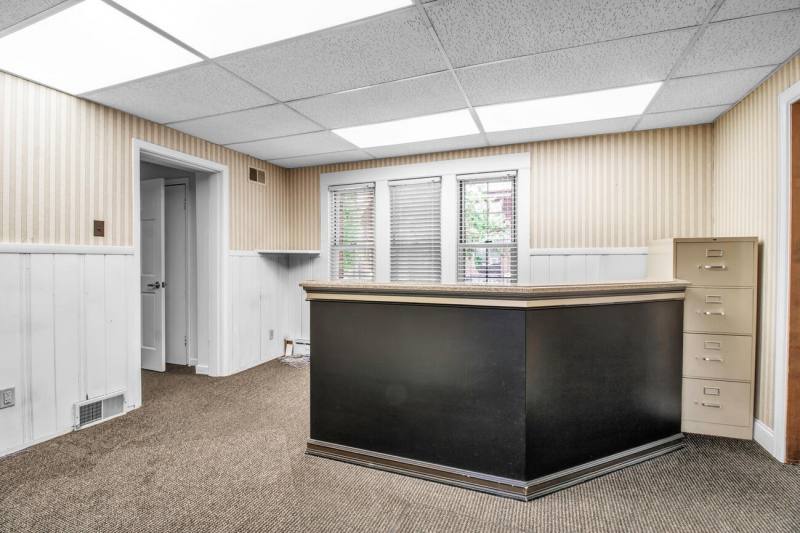
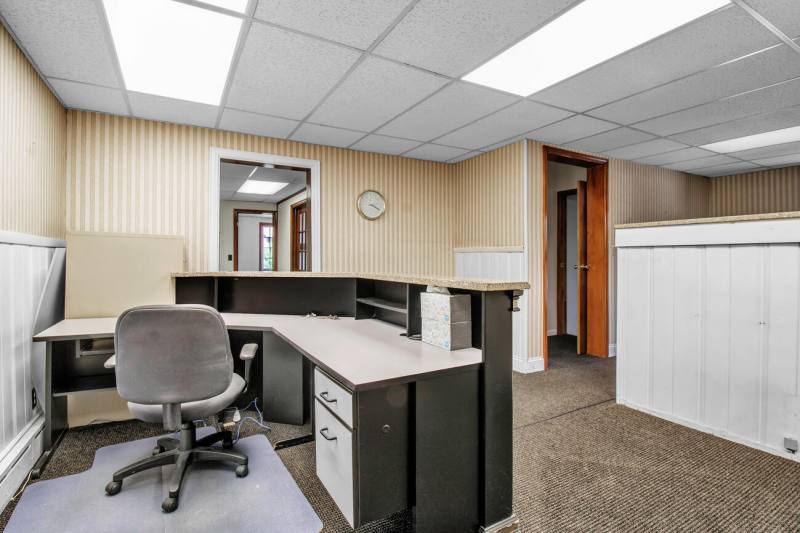
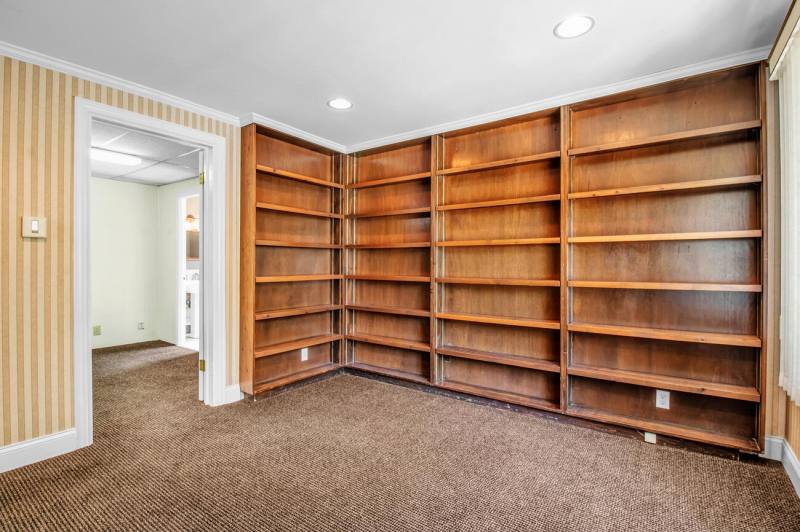
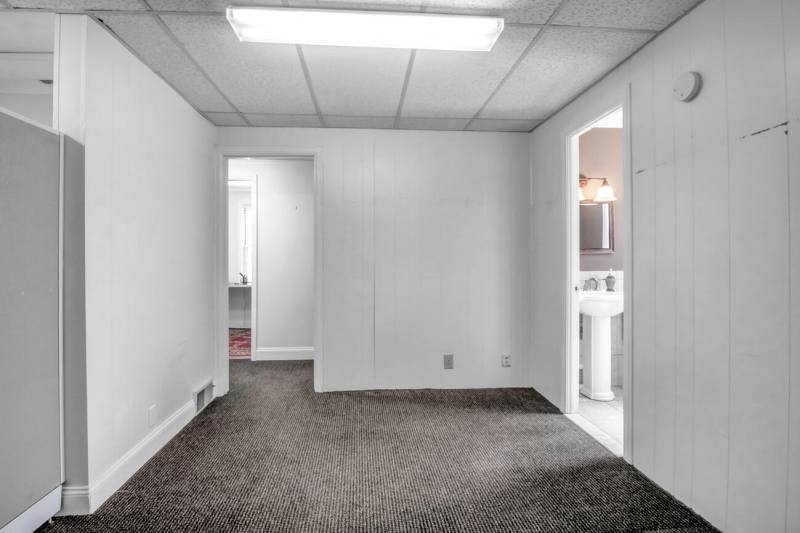
• Two stories with multiple large offices or conference rooms
Additional Photos

Listing Agents

Emily Cornwell
O: 716-909-1375
ECornwell@HannaCRE.com
O: 716-909-1375
ECornwell@HannaCRE.com
While we strive to provide the most accurate information, all listing information, and demographic data, is provided by third-parties. As such, MyEListing will not be responsible for the accuracy of the information. It is strongly recommended that you verify all information with the listing agent, and any relevant agencies, prior to making any decisions.