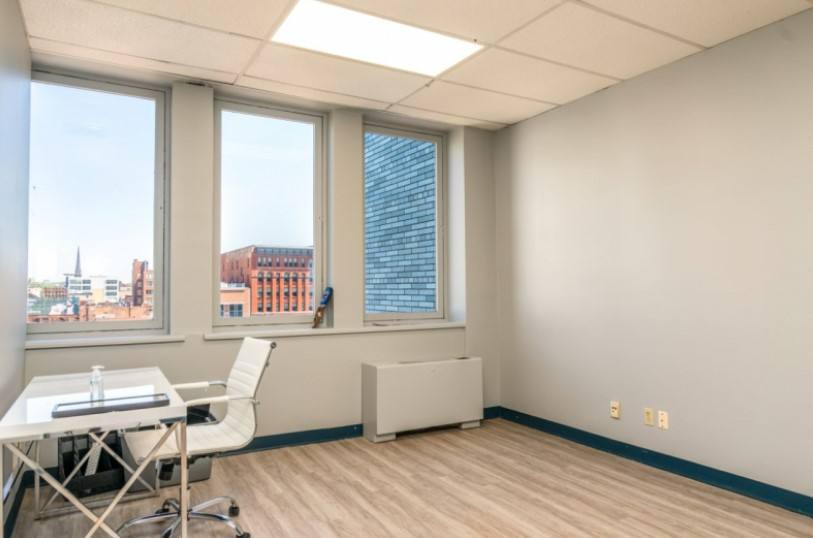
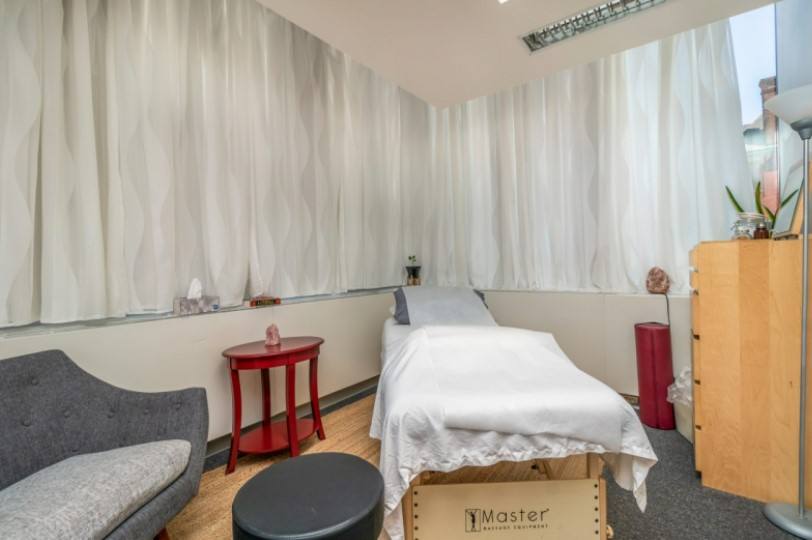
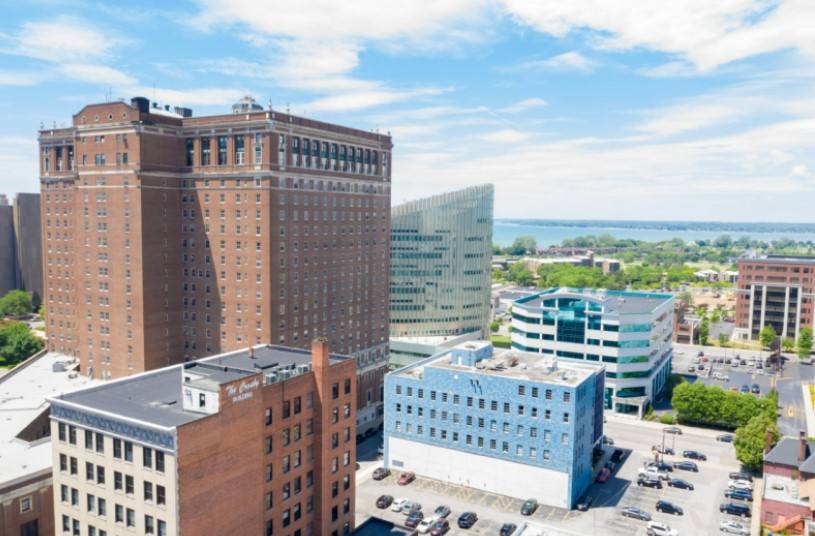
Office Space
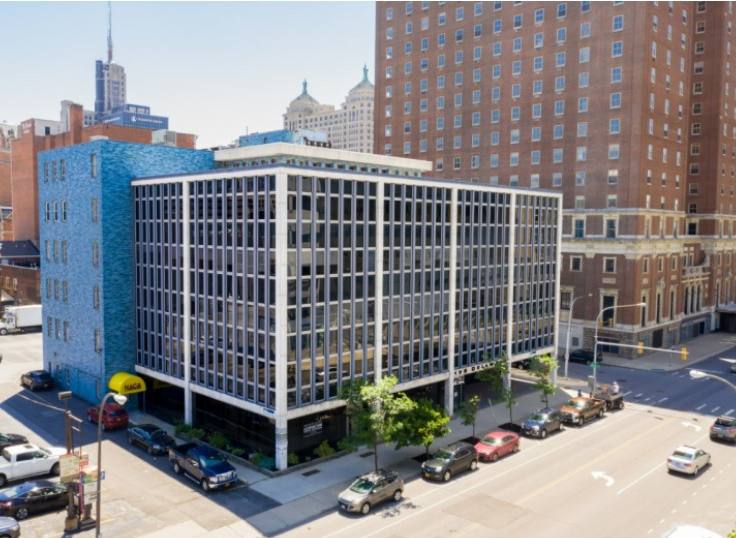
135 Delaware Avenue Buffalo, NY 14202
135 Delaware Avenue Buffalo, NY 14202
Details & Description
Property Highlights
- • On site parking included in lease!
- • Close to courts
- • Buildouts to suit tenant needs
- • Building SF 74,941
- • Acres 0.340
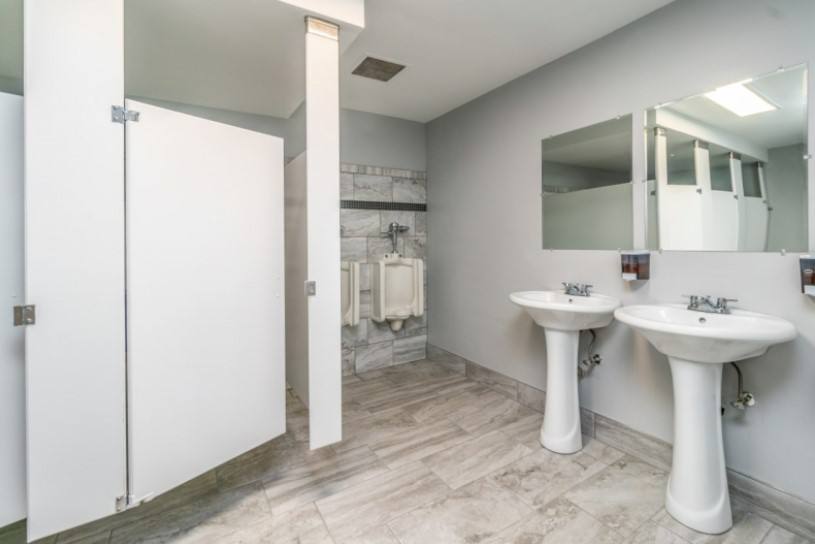
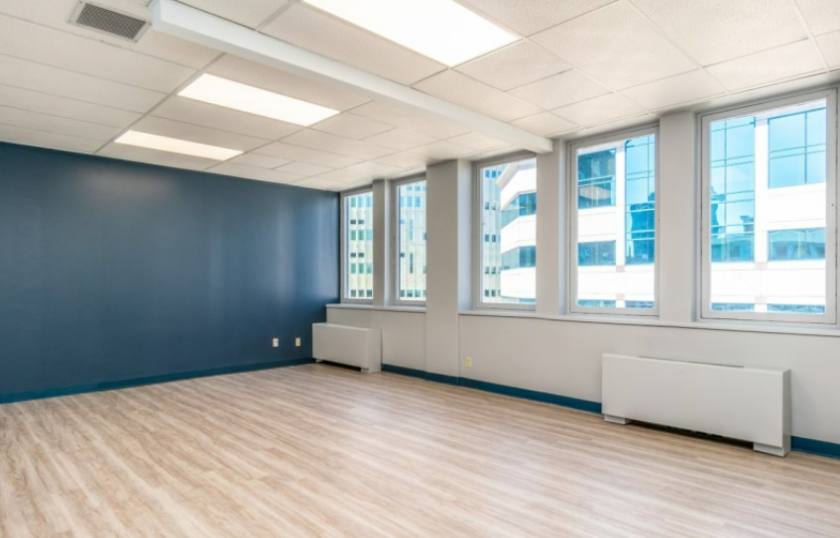
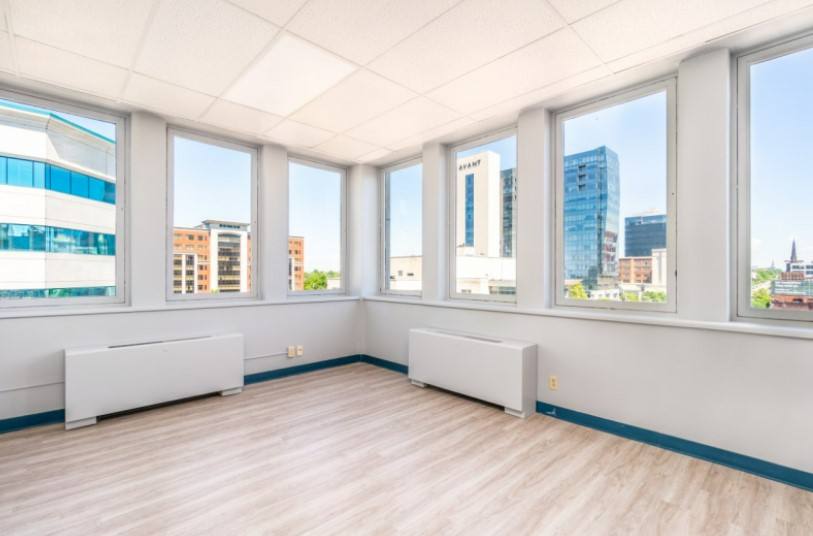
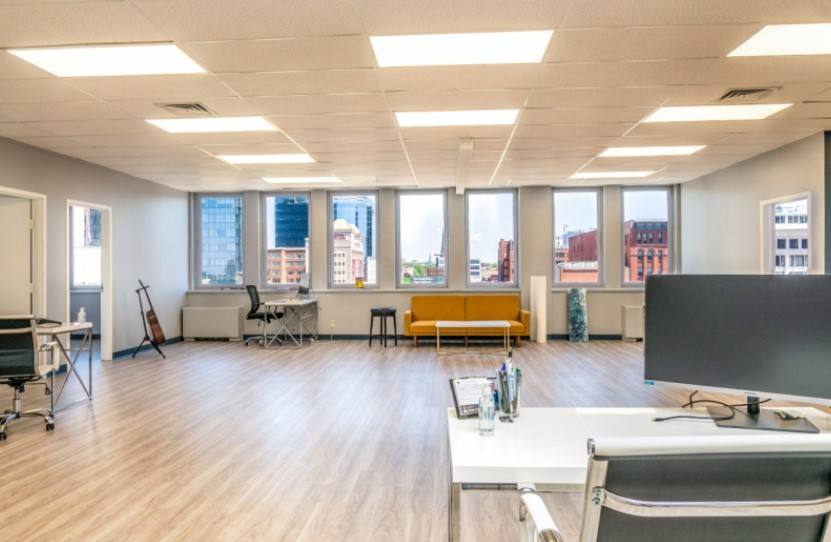
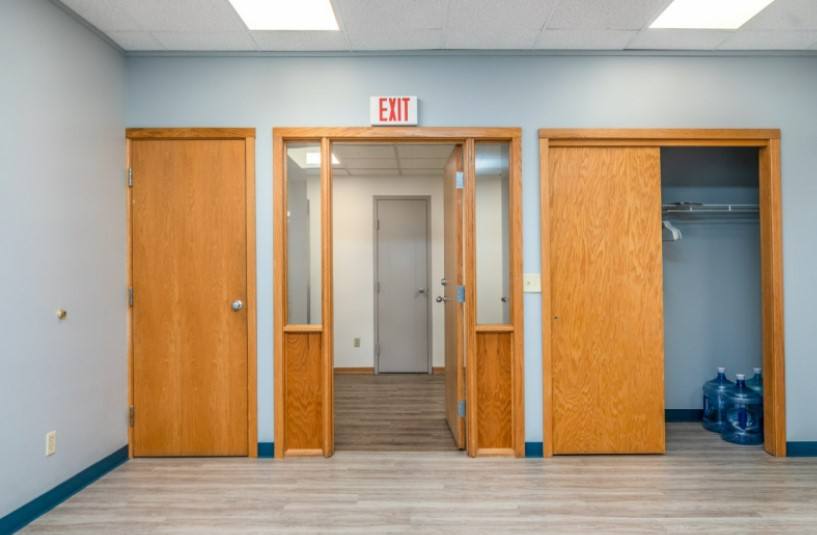
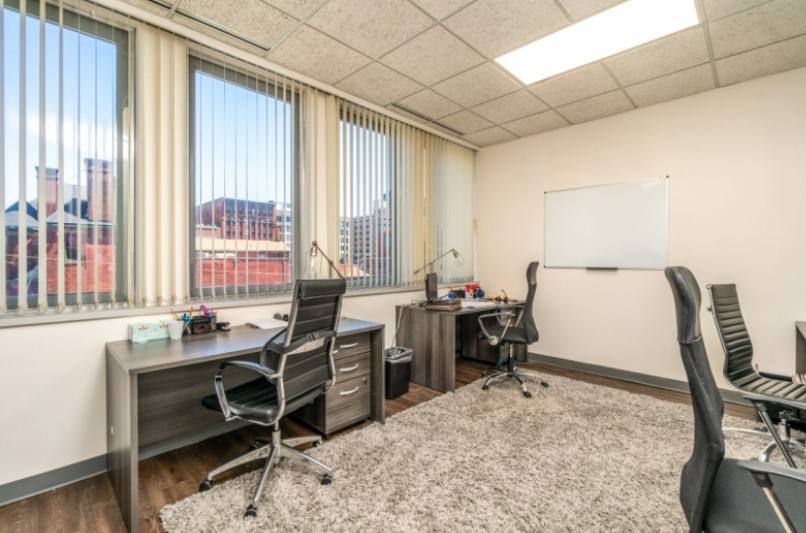
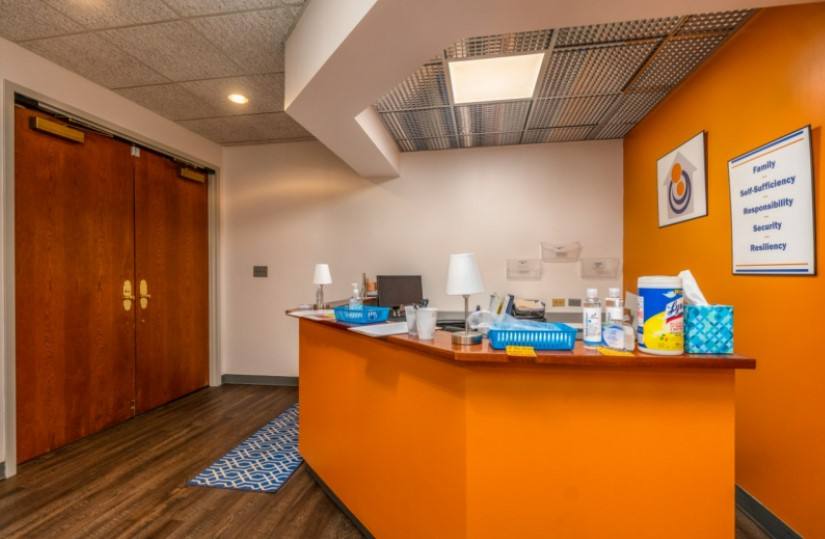
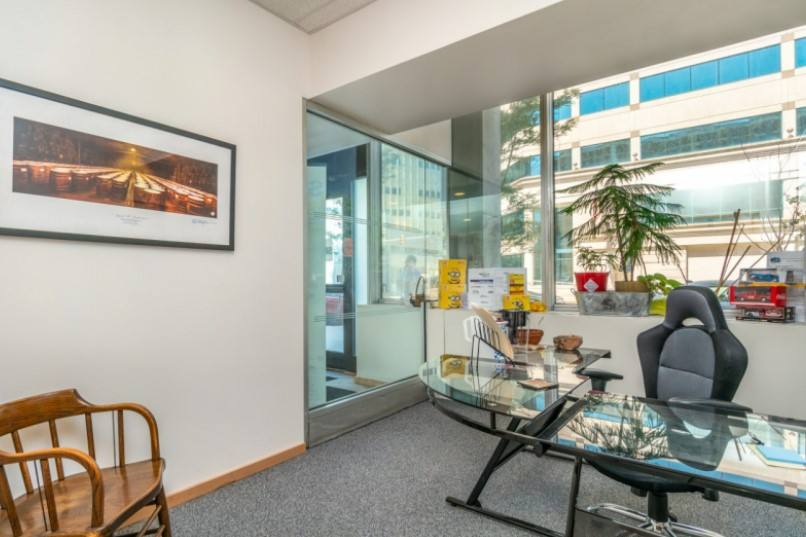
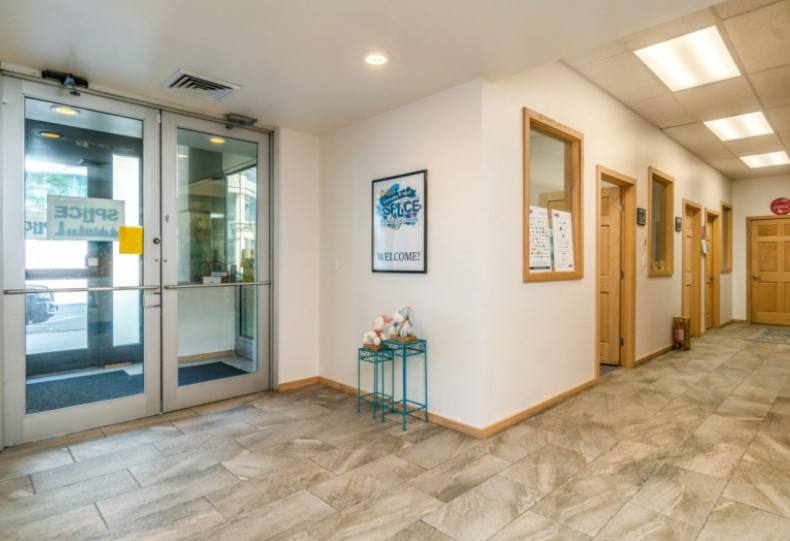
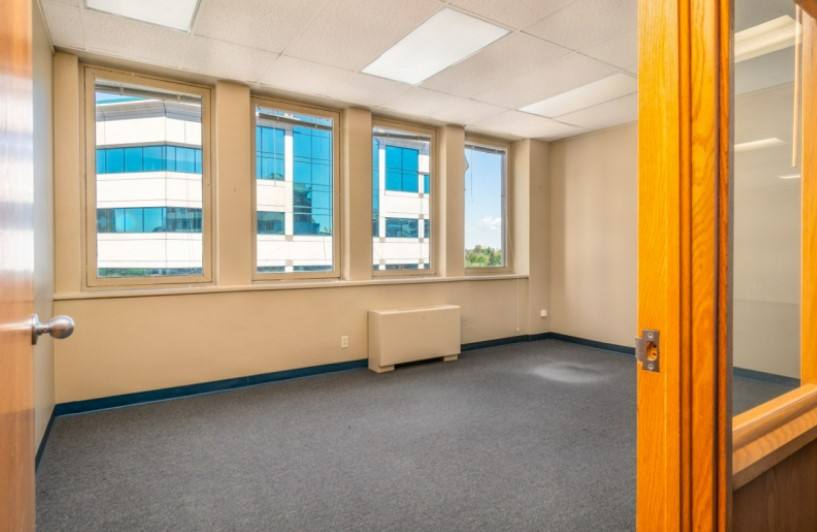
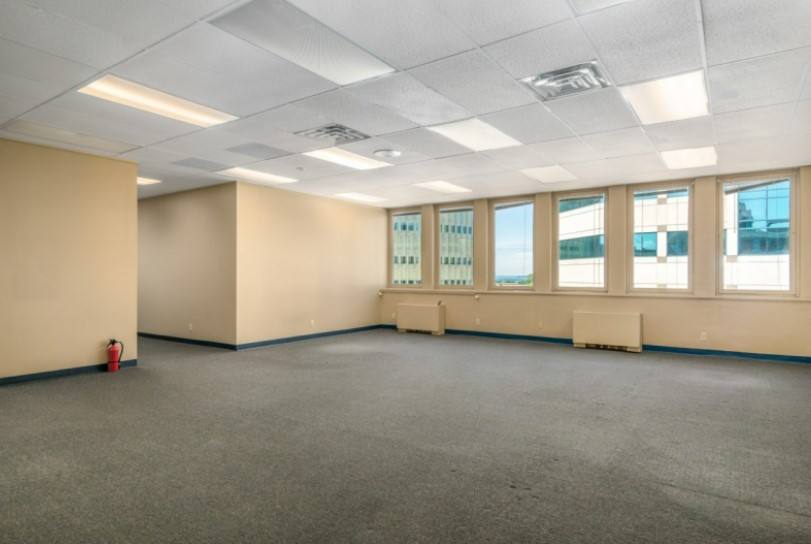
Additional Photos

Listing Agents

Michael Kaderabeck
O: 716-856-7107
MichaelKaderabeck@hannacre.com
O: 716-856-7107
MichaelKaderabeck@hannacre.com
While we strive to provide the most accurate information, all listing information, and demographic data, is provided by third-parties. As such, MyEListing will not be responsible for the accuracy of the information. It is strongly recommended that you verify all information with the listing agent, and any relevant agencies, prior to making any decisions.