Retail Space
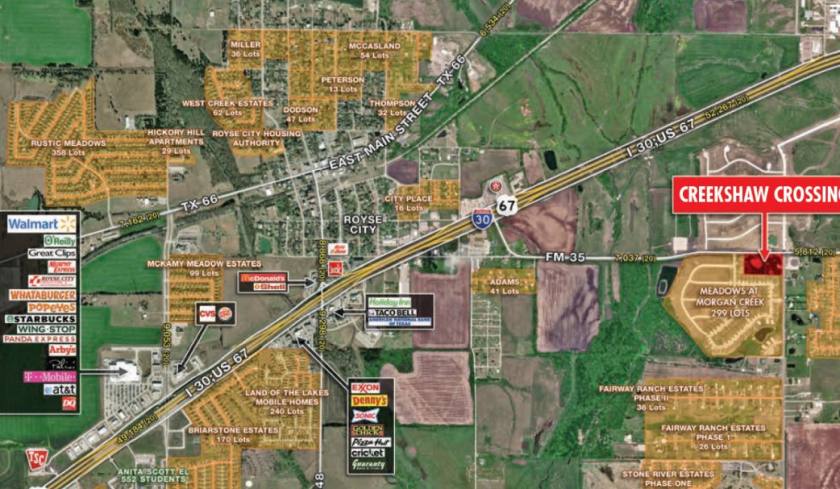
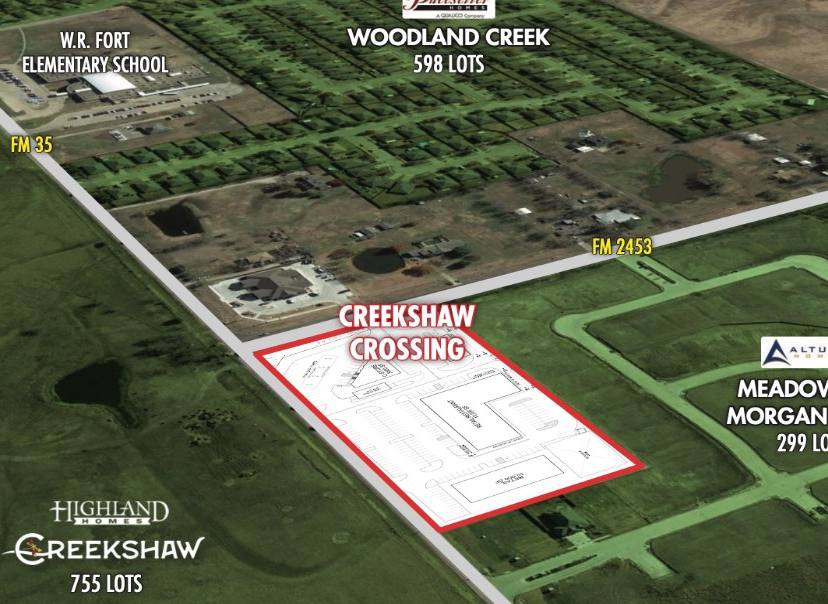
FM 35 and FM 2453 Royse City, TX 75189
FM 35 and FM 2453 Royse City, TX 75189
Details & Description
Property Highlights
• Surrounded by dense single-family developments with a younger demographic
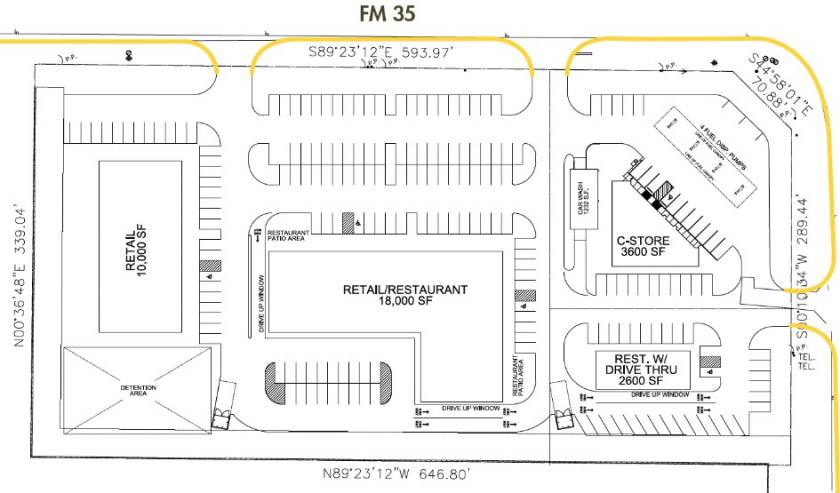
• Hard corner pad and drive-thru opportunities available
Listing Agents

Taylor LeMaster
M: 972-764-6004
tlemaster@inroadsrealty.com
M: 972-764-6004
tlemaster@inroadsrealty.com

Kyndall Misak
Inroads Realty
M: 972-764-5430
kmisak@inroadsrealty.com
Inroads Realty
M: 972-764-5430
kmisak@inroadsrealty.com
While we strive to provide the most accurate information, all listing information, and demographic data, is provided by third-parties. As such, MyEListing will not be responsible for the accuracy of the information. It is strongly recommended that you verify all information with the listing agent, and any relevant agencies, prior to making any decisions.