Commercial Land
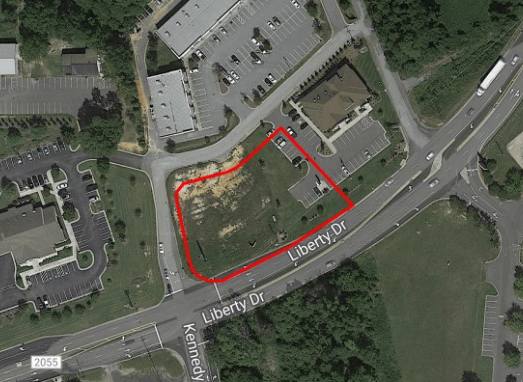
1602 Liberty Drive Thomasville, NC 27360
1602 Liberty Drive Thomasville, NC 27360
Details & Description
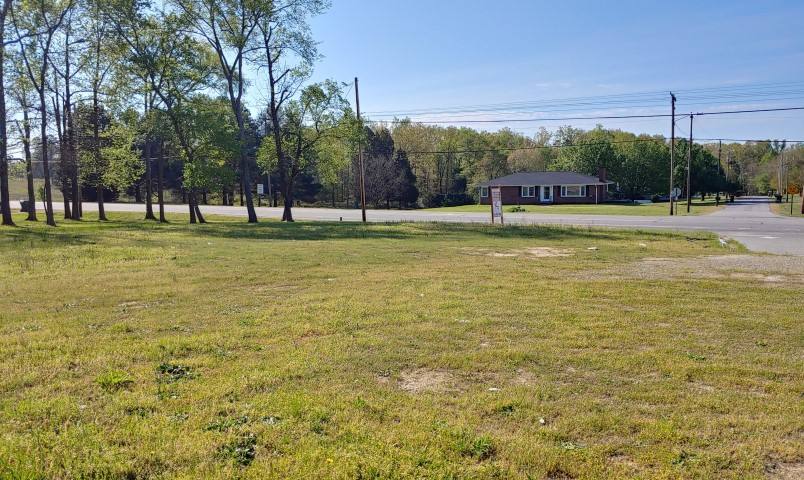
Additional Photos


Listing Agents

Mark Lindsay
O: 336-878-5171
M: 336-692-5612
LindsayRealEstateHoldings@gmail.com
O: 336-878-5171
M: 336-692-5612
LindsayRealEstateHoldings@gmail.com
While we strive to provide the most accurate information, all listing information, and demographic data, is provided by third-parties. As such, MyEListing will not be responsible for the accuracy of the information. It is strongly recommended that you verify all information with the listing agent, and any relevant agencies, prior to making any decisions.


