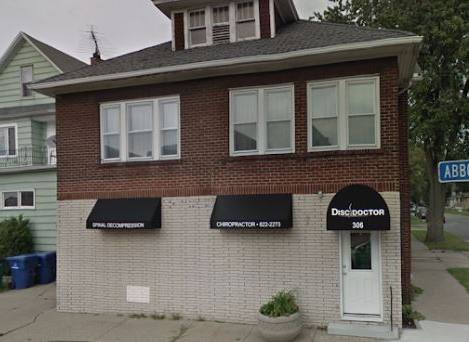
1-Mile | 3-Miles | 5-Miles | ||
---|---|---|---|---|
Total Population | 22,926 | 90,582 | 222,235 | |
Population Median Age | 39 | 40 | 40 | |
Population by Age | 0-9 Yrs | 2546 (11%) | 10060 (11%) | 25559 (11%) |
10-19 Yrs | 2876 (12%) | 10011 (11%) | 24302 (10%) | |
20-29 Yrs | 3300 (14%) | 12945 (14%) | 33668 (15%) | |
30-39 Yrs | 3376 (14%) | 12563 (13%) | 30427 (13%) | |
40-49 Yrs | 2443 (10%) | 9674 (10%) | 24402 (10%) | |
50-59 Yrs | 3469 (15%) | 13749 (15%) | 31382 (14%) | |
60-69 Yrs | 2882 (12%) | 11765 (12%) | 27413 (12%) | |
70+ Yrs | 2034 (8%) | 9813 (10%) | 25082 (11%) | |
Median HH Income | $54,339 | $45,263 | $43,727 | |
Total Household Income | < 24K | 2213 (22%) | 11946 (29%) | 30709 (30%) |
25-49K | 2219 (22%) | 9976 (24%) | 24875 (24%) | |
50-74K | 2087 (21%) | 7842 (19%) | 17760 (17%) | |
75-99K | 1292 (13%) | 4991 (12%) | 11752 (11%) | |
100-199K | 1773 (18%) | 5504 (13%) | 14022 (13%) | |
200K+ | 82 (0%) | 413 (1%) | 1942 (1%) | |
Highest Education Level | No Diploma | 1560 | 8633 | 19145 |
Diploma or GED | 5703 | 22490 | 51165 | |
Some College | 3146 | 12448 | 31857 | |
Assoc. Degree | 1930 | 8205 | 18920 | |
Bachelors Degree | 2513 | 8850 | 23254 | |
Higher Degree | 1179 | 4117 | 12945 | |
Total Housing Units | 10,843 | 46,797 | 116,549 | |
--Owner-Occupied | 5,402 | 23,174 | 53,204 | |
--Renter-Occupied | 4,264 | 17,497 | 47,857 | |
Owner-Occupied Values | < 100K | 2583 | 11721 | 22769 |
100-199K | 2273 | 9725 | 22790 | |
200-299K | 256 | 876 | 4295 | |
300-399K | 49 | 241 | 1292 | |
400-499K | 16 | 73 | 518 | |
500K+ | 224 | 537 | 1540 | |
Total Working Age Population | 18,624 | 74,388 | 181,737 | |
In Work Force | 12,071 | 45,741 | 111,016 | |
Not In Work Force | 6,553 | 28,647 | 70,721 | |
Workforce Employed | 11,249 | 42,601 | 103,160 | |
Workforce Unemployed | 823 | 3,123 | 7,788 | |
Civlian Workforce | 12,071 | 45,724 | 110,947 | |
Military Workforce | 0 | 17 | 69 | |
Total Households | 9,666 | 40,671 | 101,060 | |
Family Households | 5,643 | 21,931 | 52,561 | |
Non-Family Households | 4,022 | 18,740 | 48,500 | |
Married Couple | 3,297 | 12,954 | 29,751 | |
Other Family | 2,346 | 8,977 | 22,809 | |
Married w/Child | 1,277 | 4,267 | 10,255 | |
Single Male w/Child | 212 | 1,046 | 2,227 | |
Single Female w/Child | 806 | 3,276 | 9,005 |
Population Change Last Two Decades - Plus Projection
2000 | % | 2010 | % | 2020 | % | 2030 | |
---|---|---|---|---|---|---|---|
New York | 18,976,457 | +2 | 19,378,102 | +4 | 20,146,131 | +2 | 20,604,030 |
Erie County | 950,265 | -3 | 919,040 | +2 | 936,084 | +1 | 949,073 |
Total Working Age Population:
Total Households:
Total Working Age Population:
Total Households:
Total Working Age Population:
Total Households: