Industrial Properties
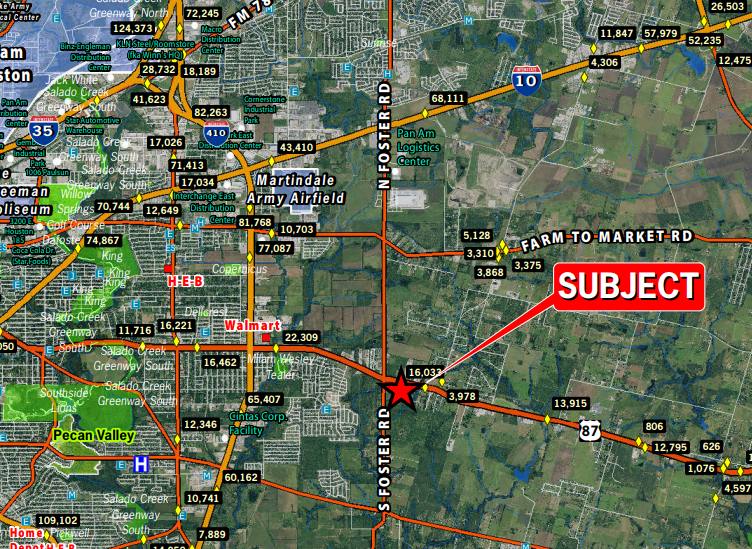
6750 Rigsby Avenue China Grove, TX 78263
6750 Rigsby Avenue China Grove, TX 78263
Details & Description
Property Highlights
- • Just outside Loop 410 on Highway 87 in China Grove
- • Excellent visibility
- • Quick access to Hwy 87
- • Immediate ingress to Hwy 87
- • China Grove is a great town to do business
Additional Photos


Listing Agents

Michael Morse
O: 210-524-4000
M: 210-524-1312
mmorse@reocsanantonio.com
O: 210-524-4000
M: 210-524-1312
mmorse@reocsanantonio.com
While we strive to provide the most accurate information, all listing information, and demographic data, is provided by third-parties. As such, MyEListing will not be responsible for the accuracy of the information. It is strongly recommended that you verify all information with the listing agent, and any relevant agencies, prior to making any decisions.


