Industrial Properties
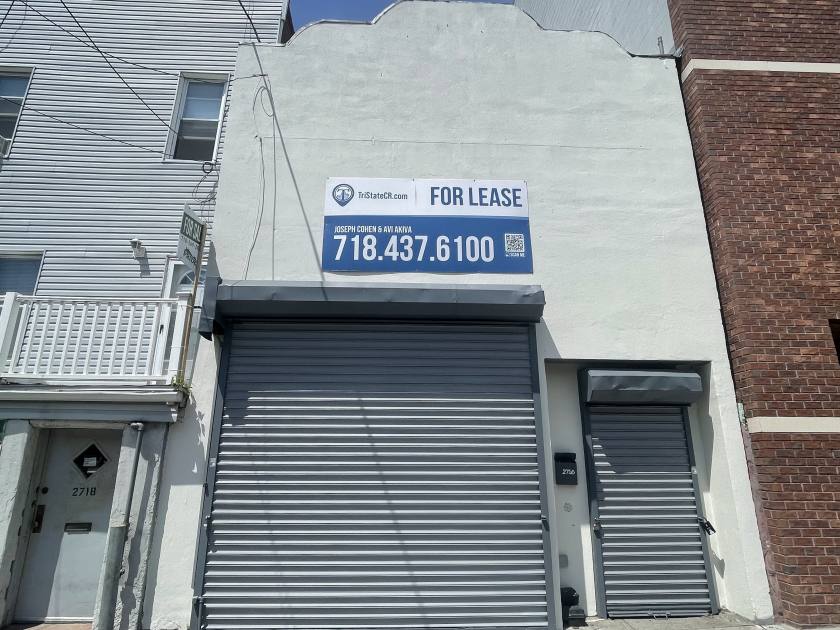
2716 West 15th Street Brooklyn, NY 11224
2716 West 15th Street Brooklyn, NY 11224
Details & Description
Property Highlights
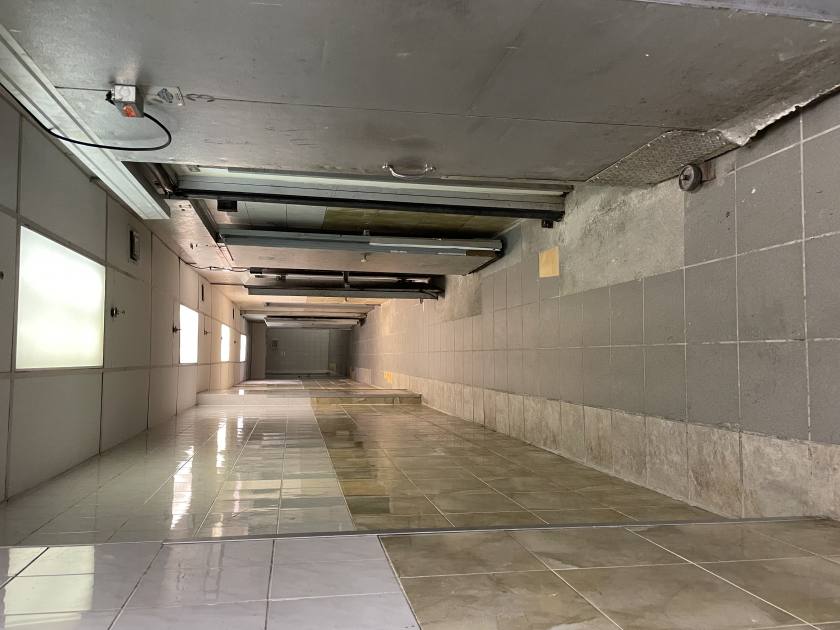
- • Two floors
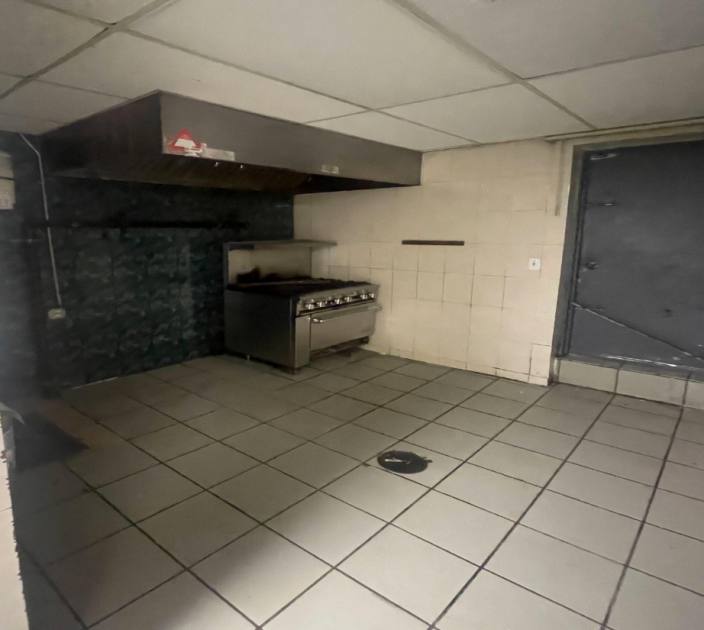
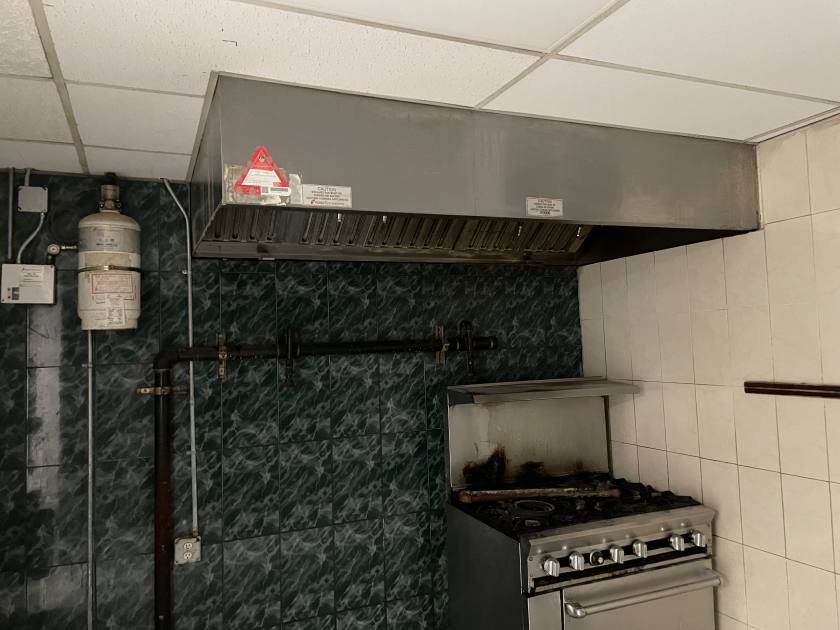
- • Built out commissary
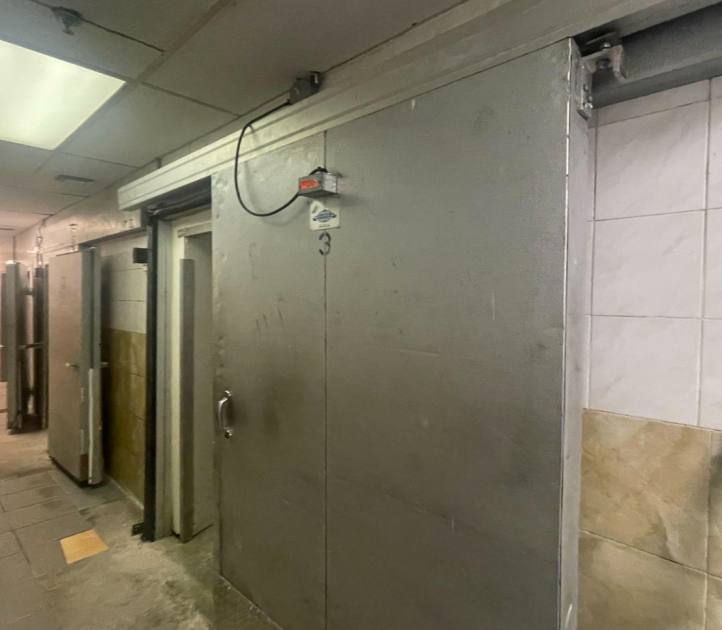
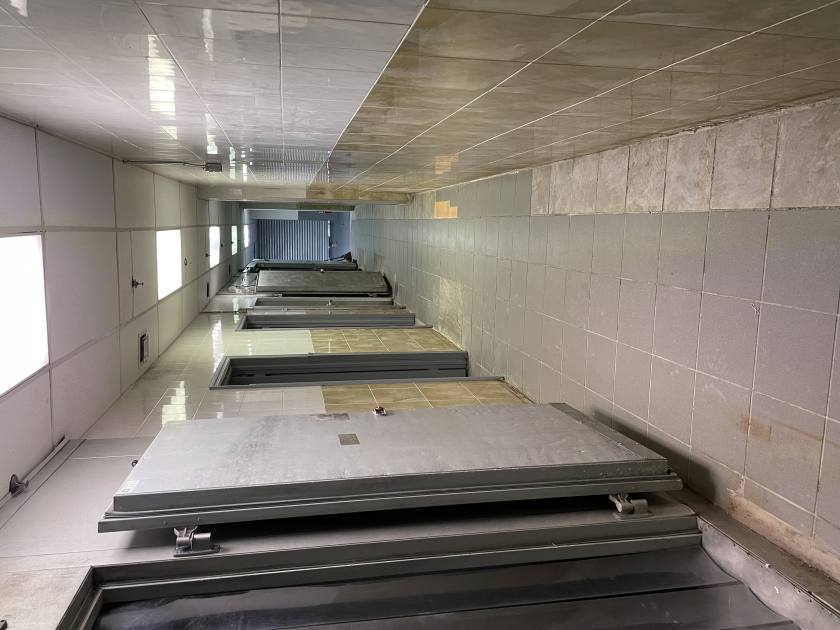
- • Multiple walk-in boxes
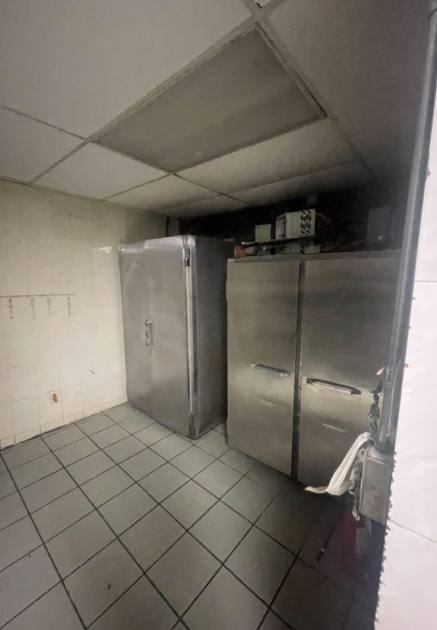
- • Refrigerators & freezers in place
- • Vented with hood
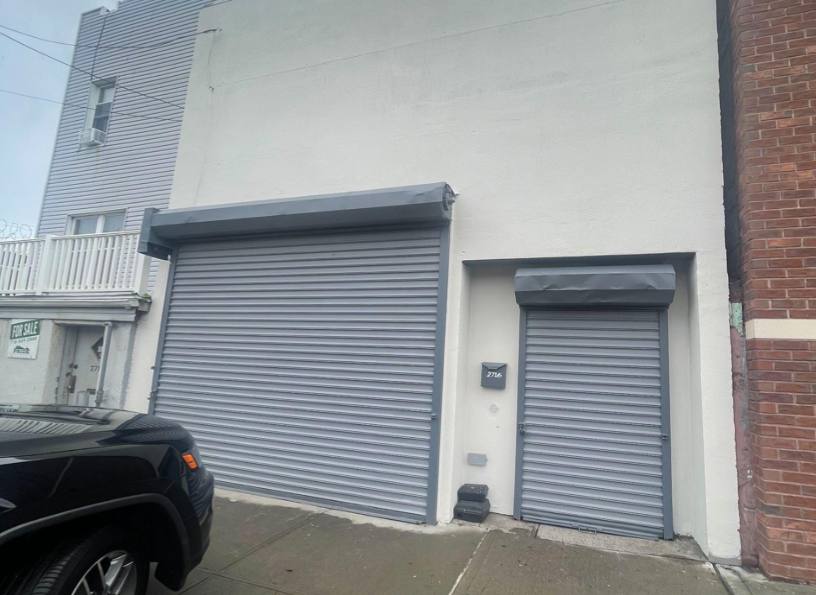
- • Drive-in gate
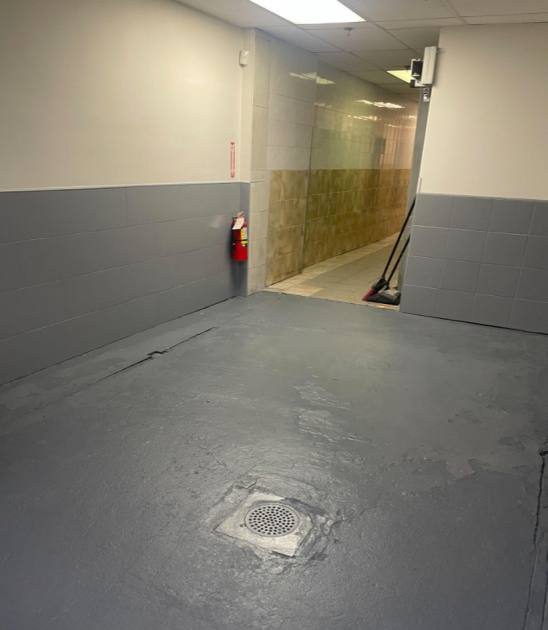
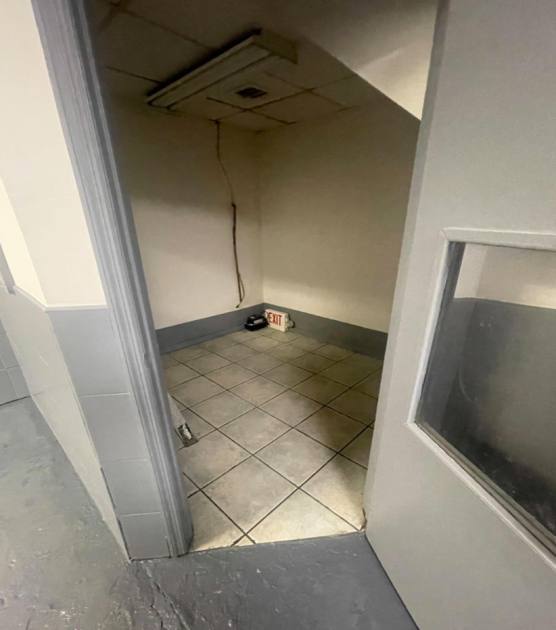
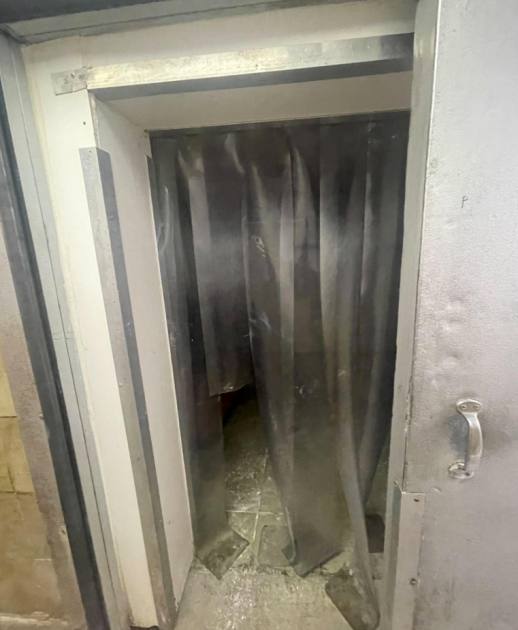
Additional Photos

Listing Agents

Shlomi Bagdadi
O: 718-437-6100
info@tristatecr.com
O: 718-437-6100
info@tristatecr.com
While we strive to provide the most accurate information, all listing information, and demographic data, is provided by third-parties. As such, MyEListing will not be responsible for the accuracy of the information. It is strongly recommended that you verify all information with the listing agent, and any relevant agencies, prior to making any decisions.