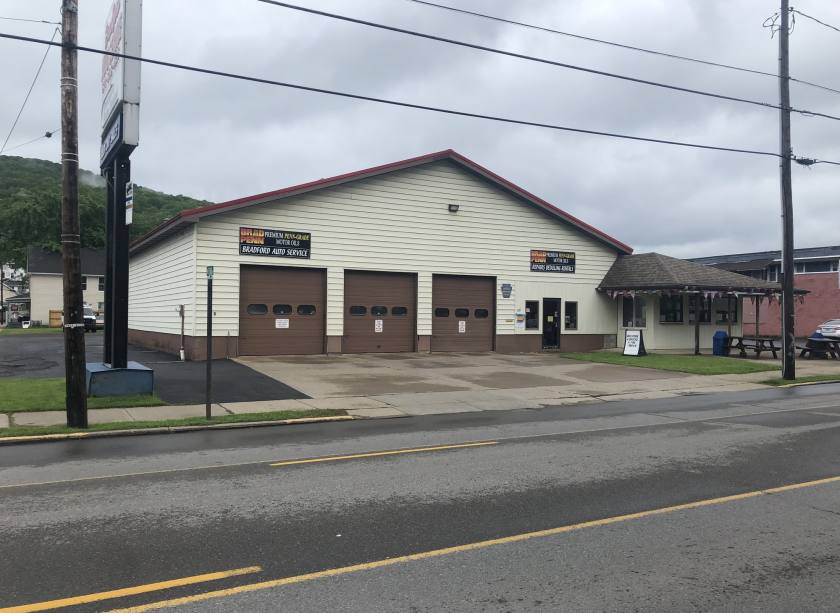
Retail Space
58 West Washington Street Bradford, PA 16701
58 West Washington Street Bradford, PA 16701
Details & Description
Property Highlights
- • Excellent Corner Location
- • Ample Parking with Rear Additional Land
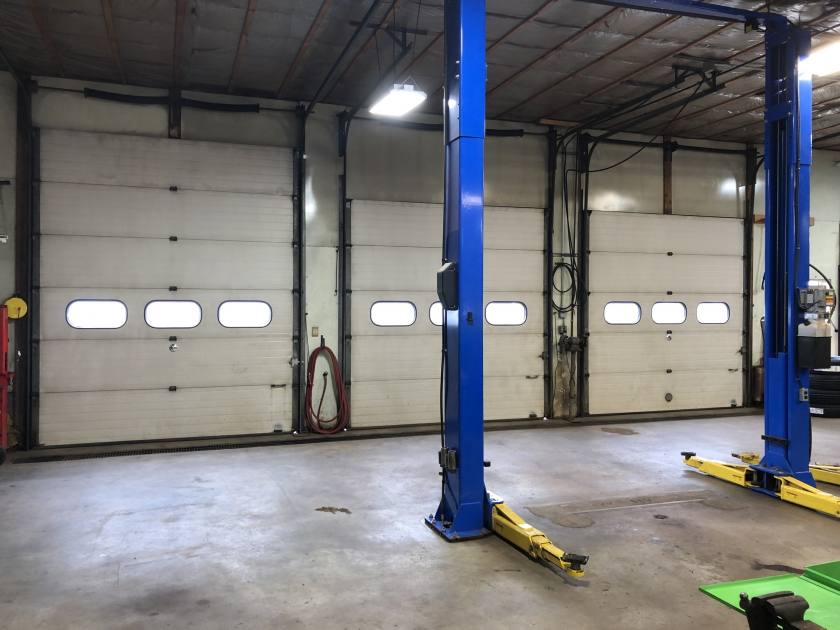
- • 12' & 14' Overhead Doors
- • Additional Retail Space for Income
- • Owner Willing to Stay and Assist New Owner
Additional Photos


Listing Agents

Rick Recckio
O: 716-631-5555
M: 716-998-4422
rick@recckio.com
O: 716-631-5555
M: 716-998-4422
rick@recckio.com
While we strive to provide the most accurate information, all listing information, and demographic data, is provided by third-parties. As such, MyEListing will not be responsible for the accuracy of the information. It is strongly recommended that you verify all information with the listing agent, and any relevant agencies, prior to making any decisions.


