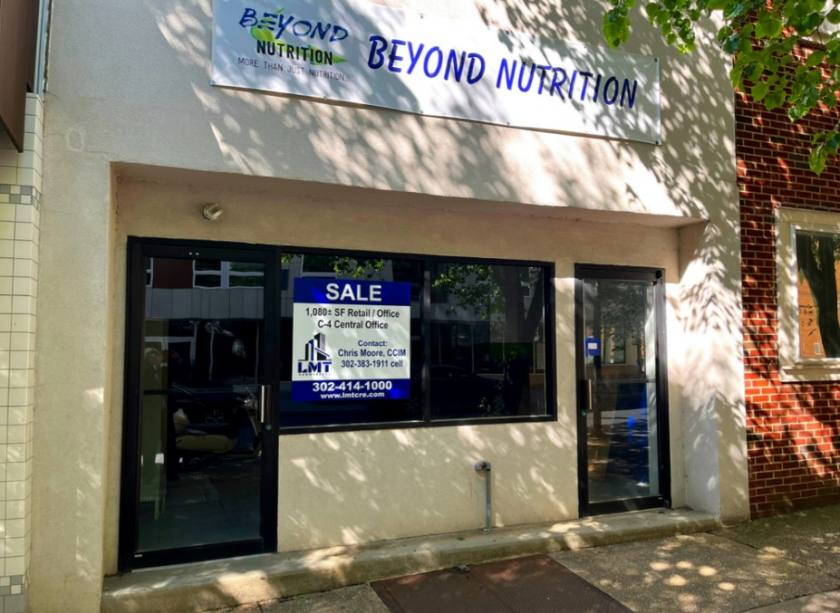
Retail Space
107 West 9th Street Wilmington, DE 19801
107 West 9th Street Wilmington, DE 19801
Details & Description
Property Highlights
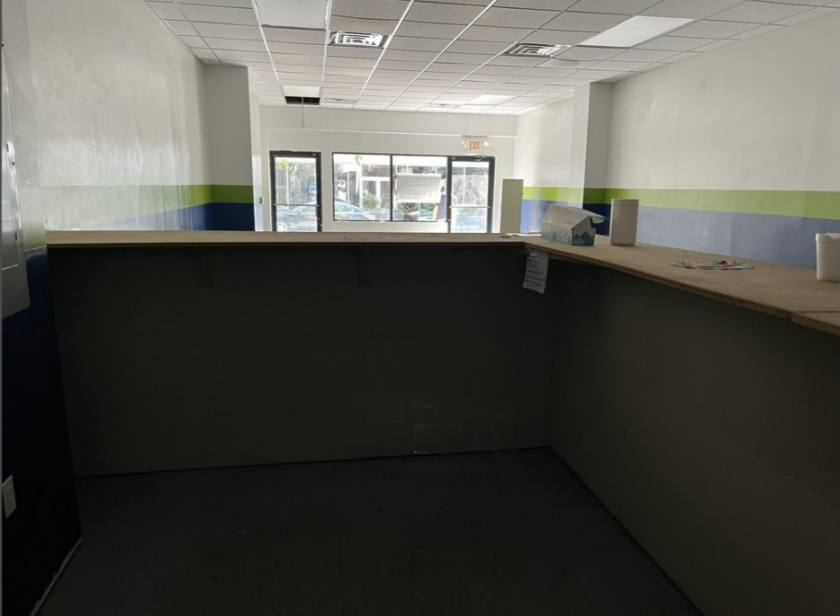
- • Vanilla Shell Condition
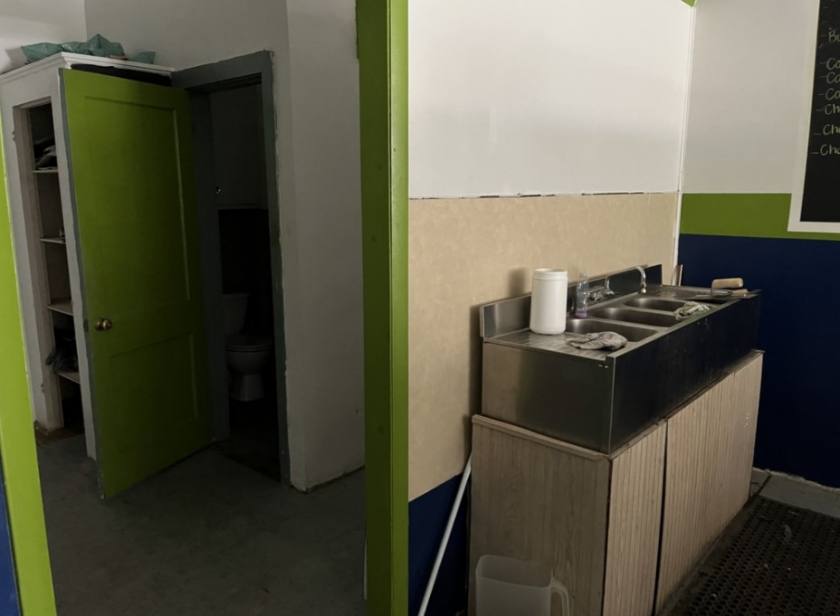
- • 1 ADA Bathroom
- • 2 Access Points on 9th Street
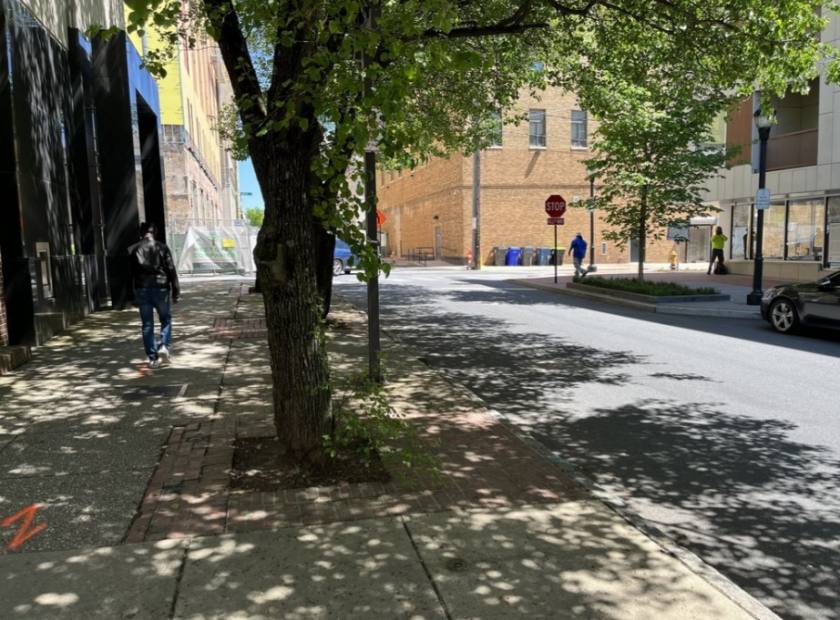
- • Close Vicinity to Major City Attractions
- • Across the Street from Midtown Apartment Complex
- • Ideal for Retail and/or Office Uses
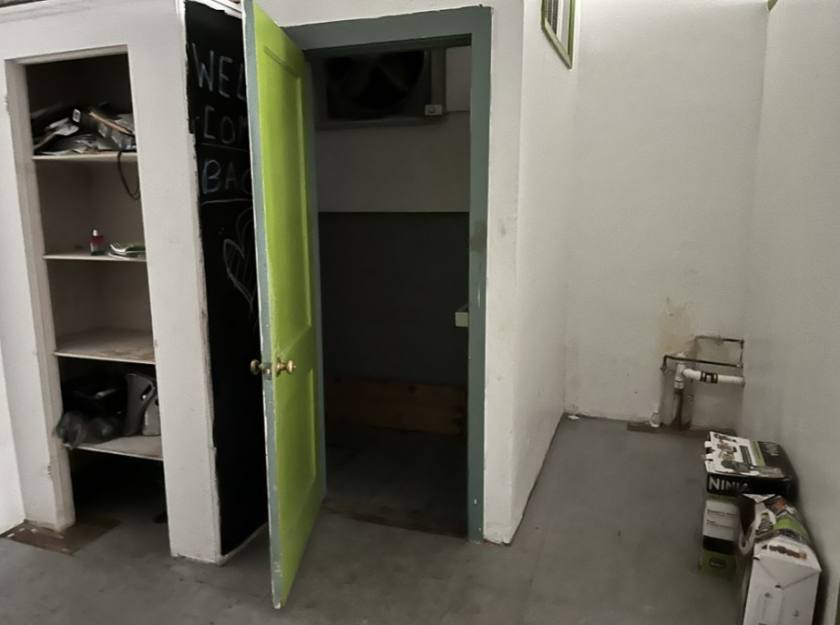
Additional Photos


Listing Agents

Chris Moore
M: 302-383-1911
moore@lmtcre.com
M: 302-383-1911
moore@lmtcre.com
While we strive to provide the most accurate information, all listing information, and demographic data, is provided by third-parties. As such, MyEListing will not be responsible for the accuracy of the information. It is strongly recommended that you verify all information with the listing agent, and any relevant agencies, prior to making any decisions.