Commercial Land
5100 Interstate 30 Fate, TX 75189
5100 Interstate 30 Fate, TX 75189
Details & Description
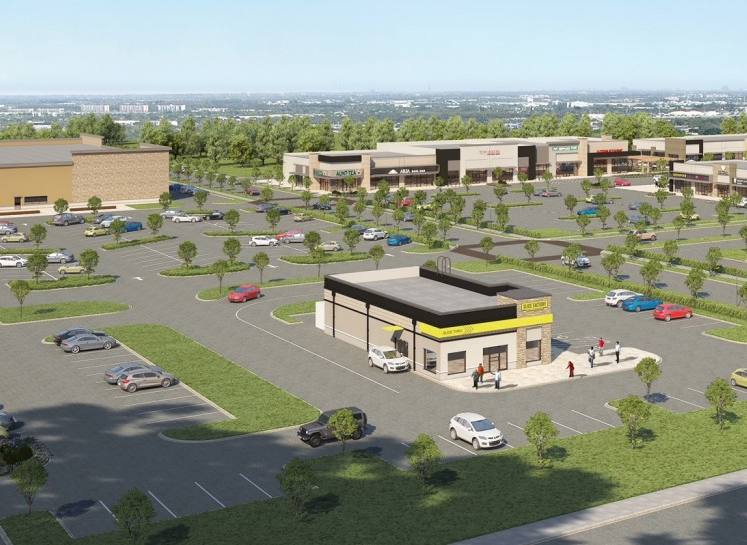
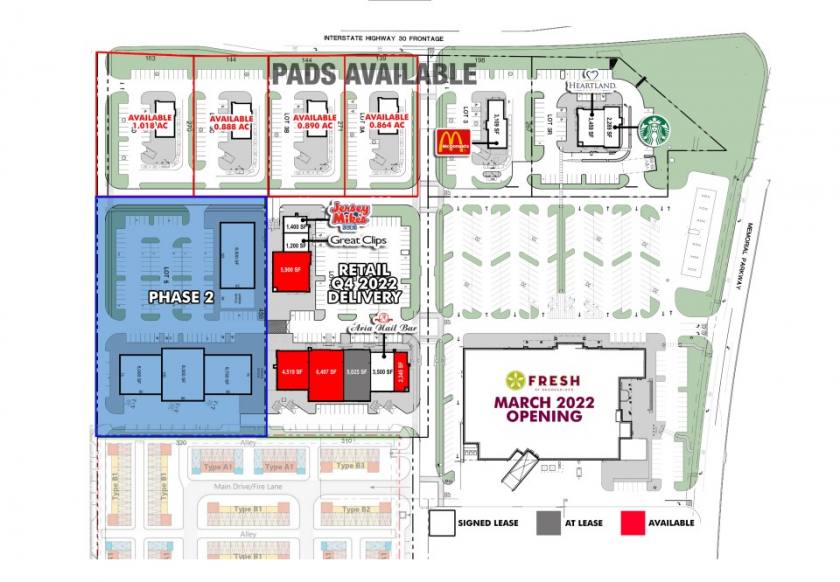
Property Highlights
- • Retail Spaces for Lease: 2345 SF - 6497 SF
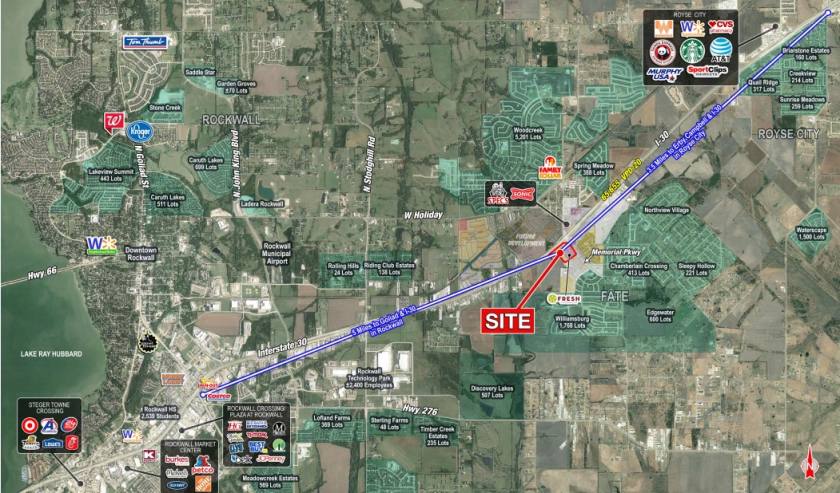
- • 109% increase in population since 2010
- • Median Household income: $108,237
- • Traffic Counts: I-30: 65,655 VPD-20
Additional Photos

Listing Agents

Thomas Glendenning
O: 214-960-4528
M: 214-960-4545
thomas@shopcompanies.com
O: 214-960-4528
M: 214-960-4545
thomas@shopcompanies.com

Jake Sherrington
O: 214-960-4545
M: 214-960-4623
jake@shopcompanies.com
O: 214-960-4545
M: 214-960-4623
jake@shopcompanies.com
While we strive to provide the most accurate information, all listing information, and demographic data, is provided by third-parties. As such, MyEListing will not be responsible for the accuracy of the information. It is strongly recommended that you verify all information with the listing agent, and any relevant agencies, prior to making any decisions.


