Retail Space
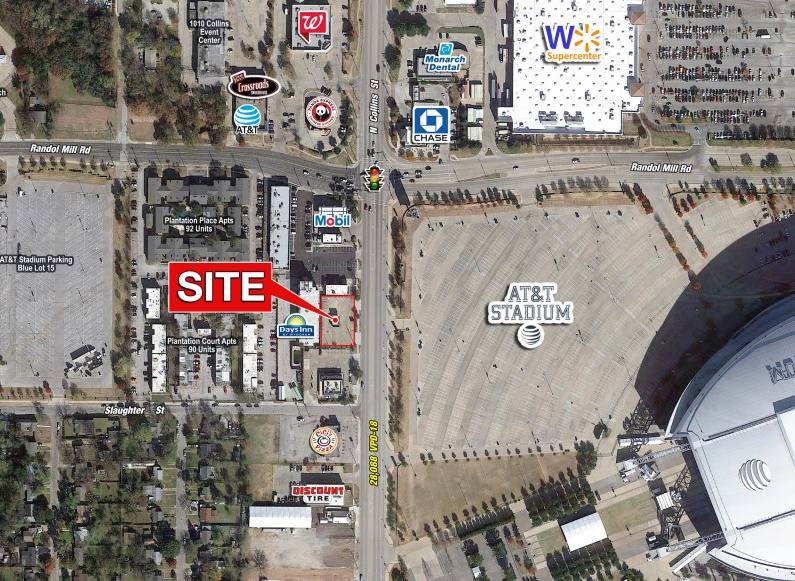
908 North Collins Street Arlington, TX 76011
908 North Collins Street Arlington, TX 76011
Details & Description
Property Highlights
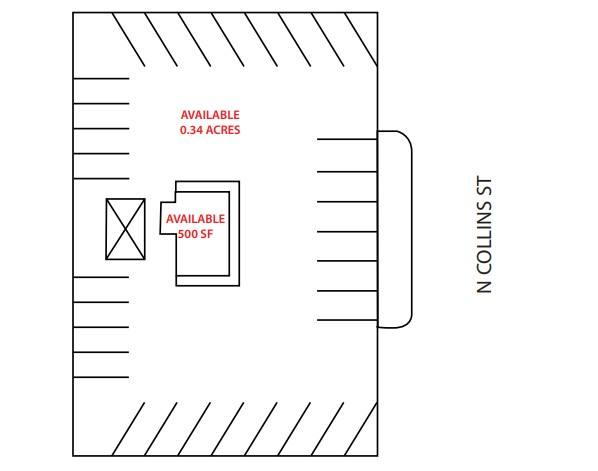
- • Approximately 500 SF Building
- • 30 Parking Spaces
- • Traffic Counts: Collins St.: 28,088 VPD-18
- • Traffic Counts: Randol Mill Rd.: 14,585 VPD-18
Additional Photos


Listing Agents

Daniel Frid
O: 214-960-4545
M: 214-501-5108
dfrid@shopcompanies.com
O: 214-960-4545
M: 214-501-5108
dfrid@shopcompanies.com
While we strive to provide the most accurate information, all listing information, and demographic data, is provided by third-parties. As such, MyEListing will not be responsible for the accuracy of the information. It is strongly recommended that you verify all information with the listing agent, and any relevant agencies, prior to making any decisions.


