Industrial Properties
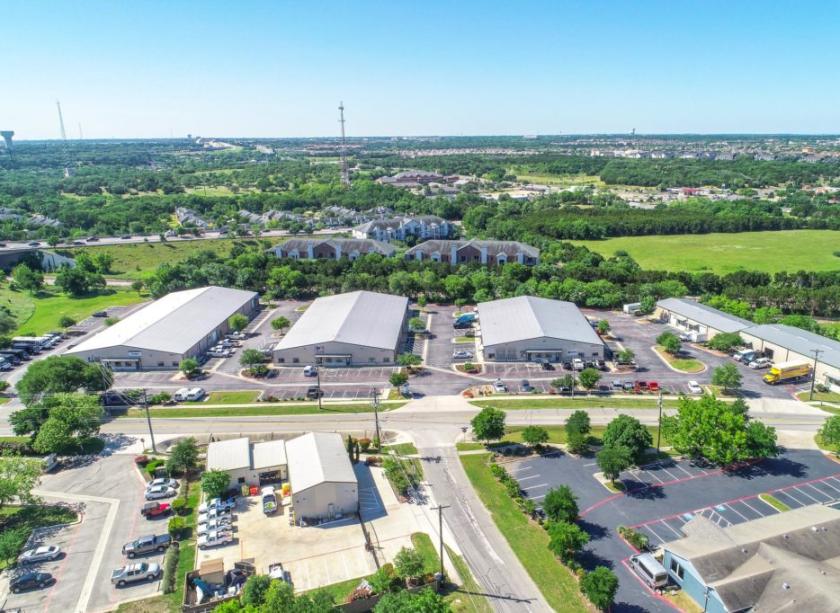
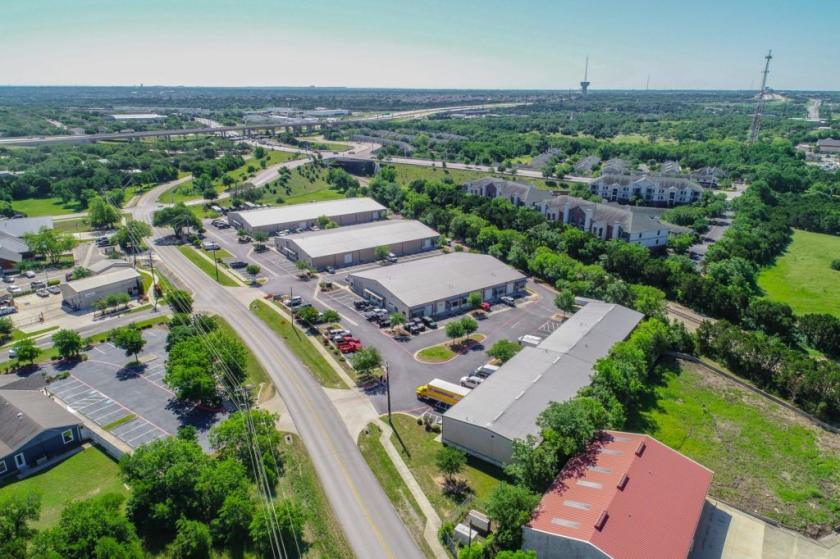
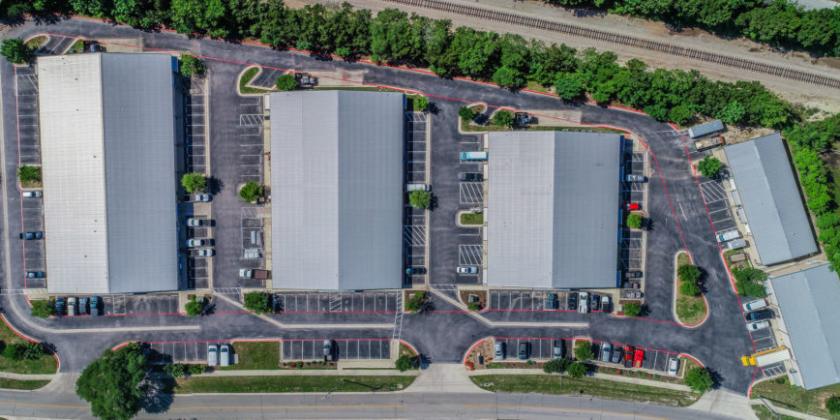
500 Brushy Creek Road Cedar Park, TX 78613
500 Brushy Creek Road Cedar Park, TX 78613
Details & Description
Property Highlights
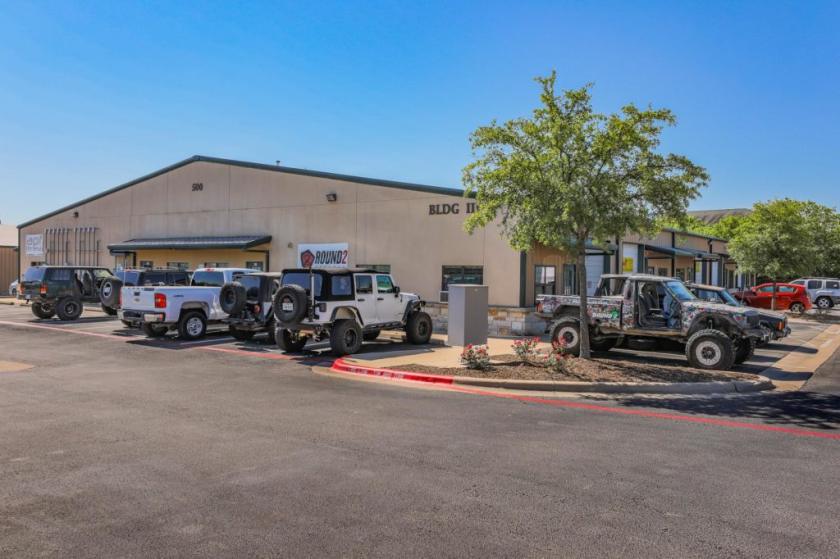
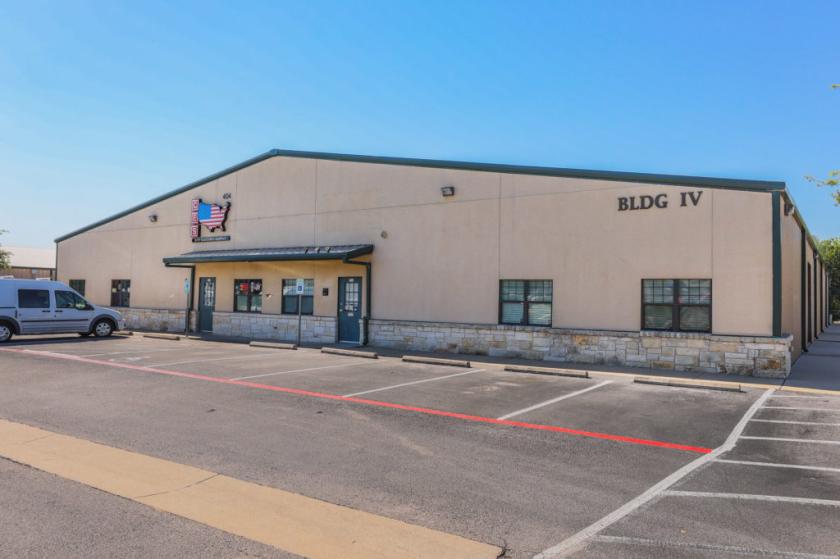
- • Office/Warehouse Space
- • 18’ Clear Height
- • Front Loading
- • Grade Level Dock Doors
- • Located in Cedar Park
Additional Photos
Listing Agents

Davis Bass
O: 512-538-1030
bass@hpitx.com
O: 512-538-1030
bass@hpitx.com

Jordan McMahon
M: 512-538-0060
jmcmahon@hpitx.com
M: 512-538-0060
jmcmahon@hpitx.com
While we strive to provide the most accurate information, all listing information, and demographic data, is provided by third-parties. As such, MyEListing will not be responsible for the accuracy of the information. It is strongly recommended that you verify all information with the listing agent, and any relevant agencies, prior to making any decisions.


