Office Space
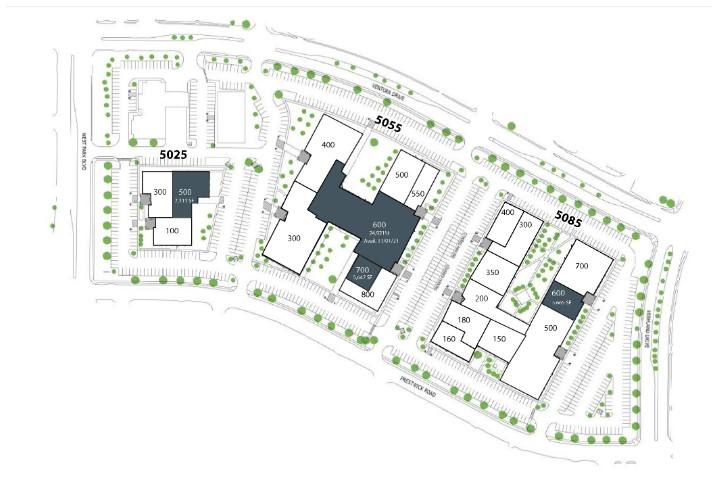
5025 - 5085 W Park Blvd Plano, TX 75093
5025 - 5085 W Park Blvd Plano, TX 75093
Details & Description
Property Highlights
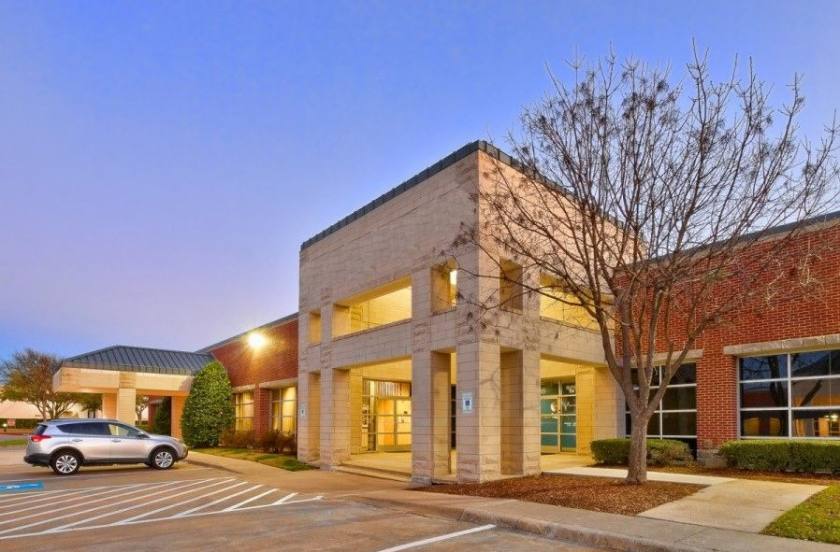
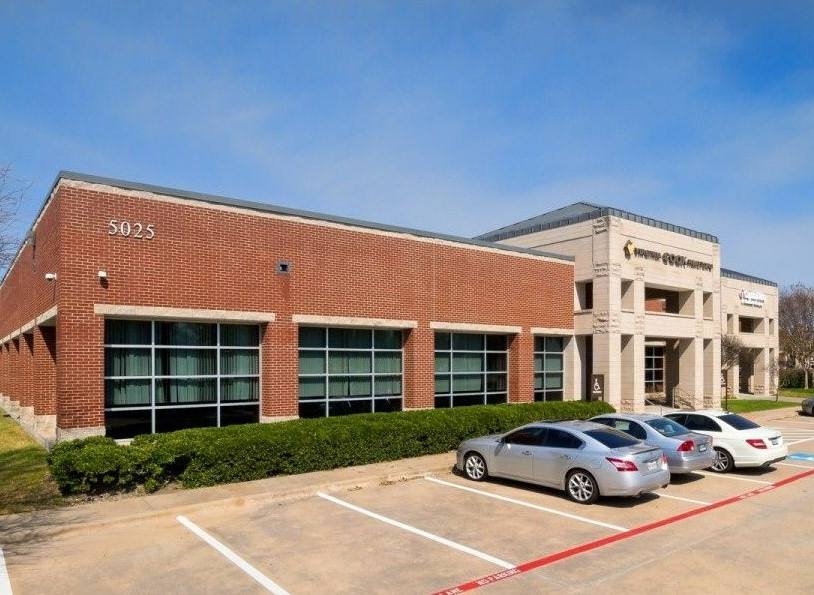
- • Prominent exterior building signage
- • Direct access to all suites
- • 24/7 tenant controlled HVAC
- • Common area factor ranging from 0-6%
- • 5/1,000 parking ratio (covered available)
- • Floor to ceiling window systems
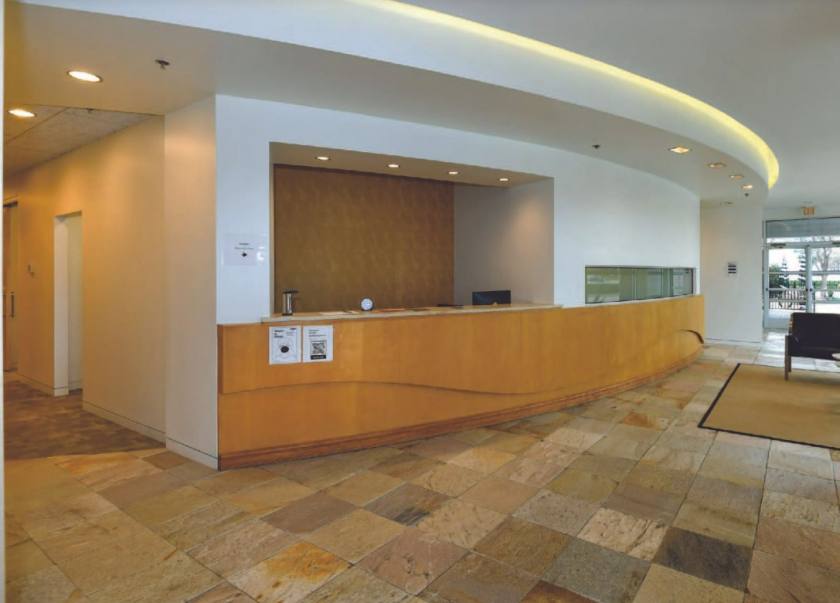
Additional Photos


Listing Agents

Kurt Cherry
O: 972-421-3322
M: 972-333-3927
kurt.cherry@madisonmarquette.com
O: 972-421-3322
M: 972-333-3927
kurt.cherry@madisonmarquette.com
While we strive to provide the most accurate information, all listing information, and demographic data, is provided by third-parties. As such, MyEListing will not be responsible for the accuracy of the information. It is strongly recommended that you verify all information with the listing agent, and any relevant agencies, prior to making any decisions.