Industrial Properties
1620 Kearney Street Port Huron, MI 48060
1620 Kearney Street Port Huron, MI 48060
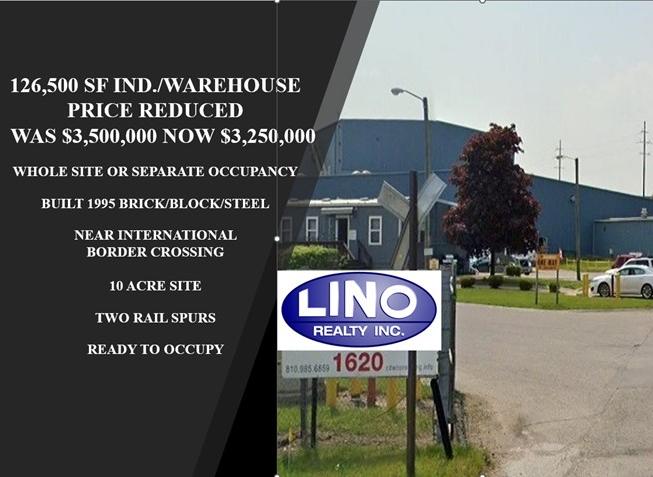
Details & Description
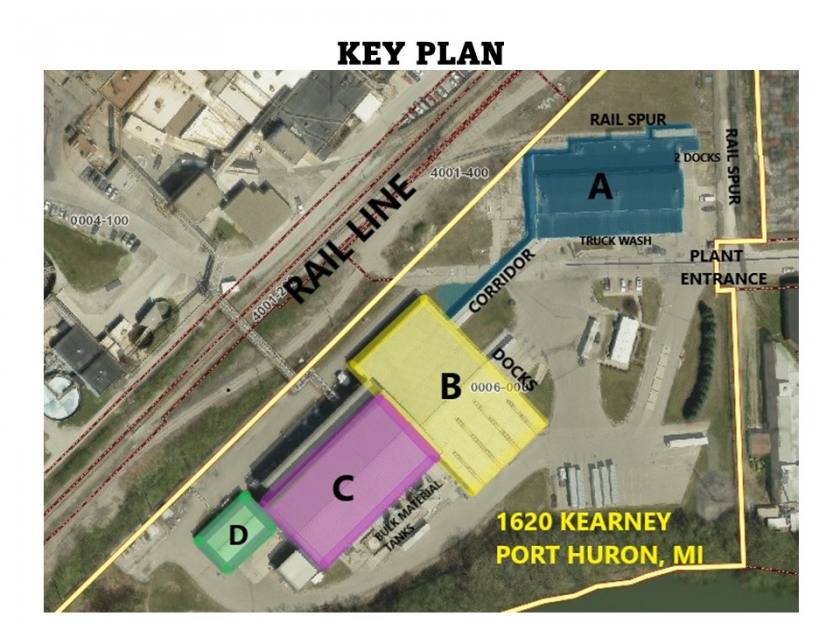
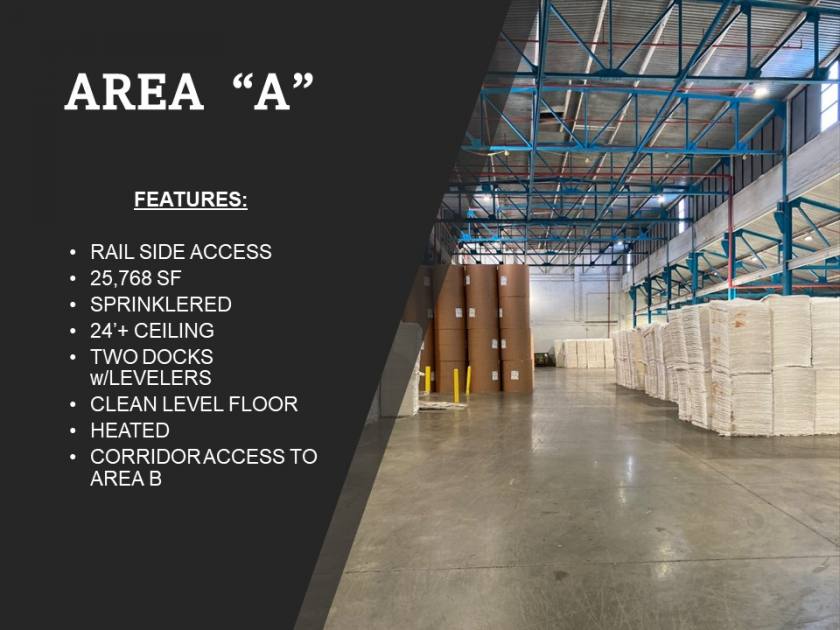
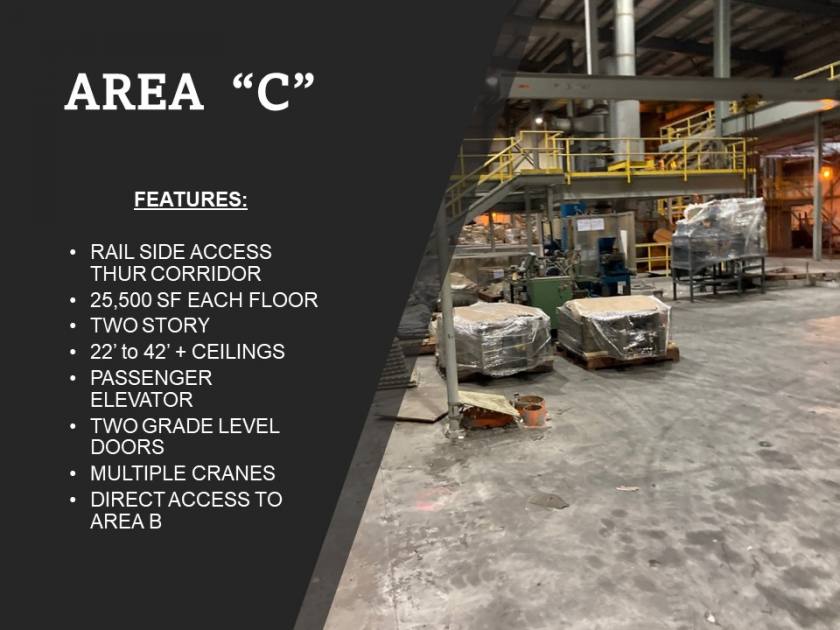
Property Highlights
- • Two Rail spurs
- • 7 loading docks
- • Truck scale
- • Bulk tank storage possible
- • Multiple cranes
- • 4 Grade level doors
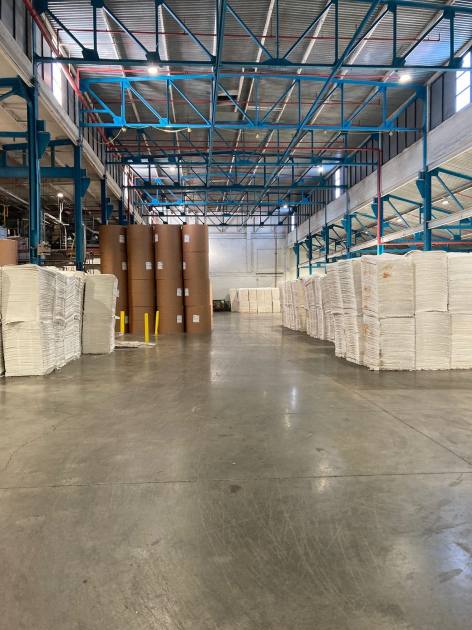
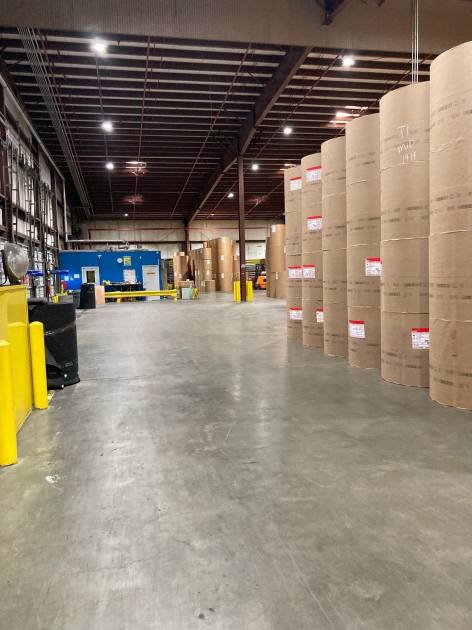
Additional Photos

Listing Agents

Robert Drewek
O: 586-263-5111
M: 586-995-7664
rob@linorealty.com
O: 586-263-5111
M: 586-995-7664
rob@linorealty.com
While we strive to provide the most accurate information, all listing information, and demographic data, is provided by third-parties. As such, MyEListing will not be responsible for the accuracy of the information. It is strongly recommended that you verify all information with the listing agent, and any relevant agencies, prior to making any decisions.