Specialty Real Estate
16065 Farm to Market Road 463 Lytle, TX 78052
16065 Farm to Market Road 463 Lytle, TX 78052
Details & Description
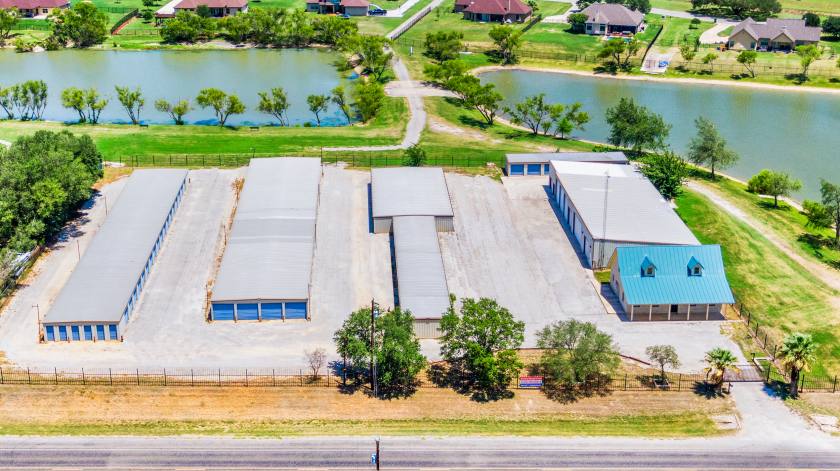
Property Highlights
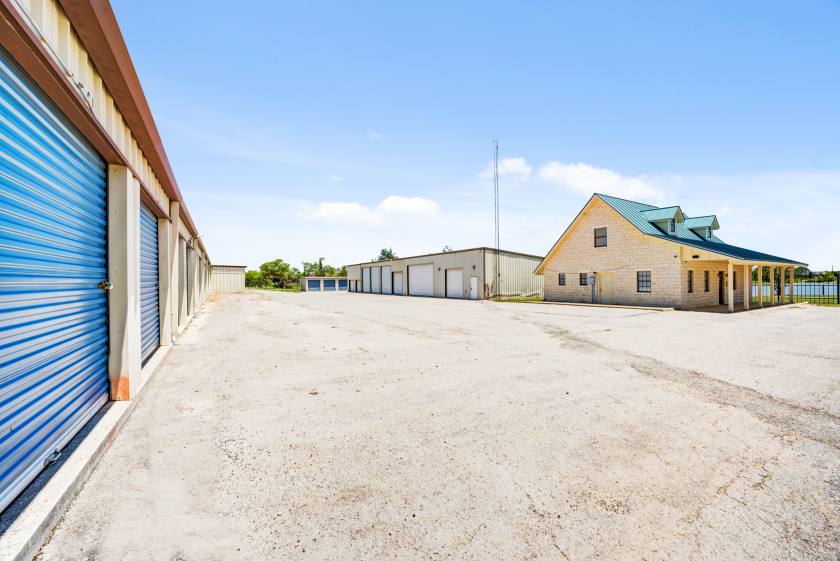
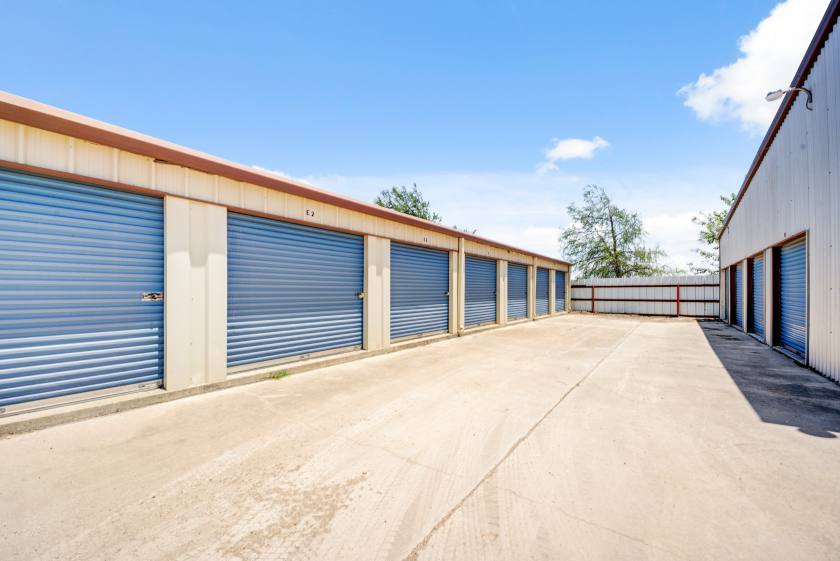
- • Fence and Paved
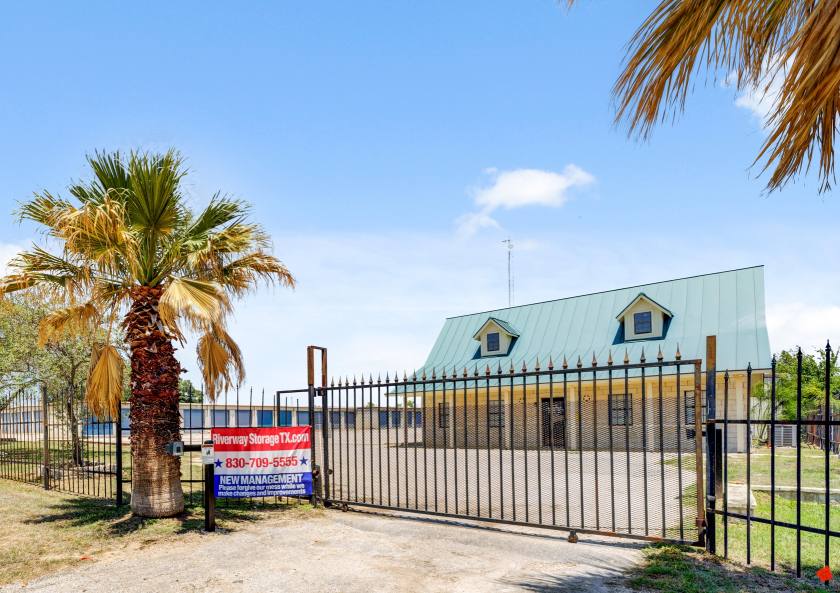
- • Automated gate system
- • Remote management system
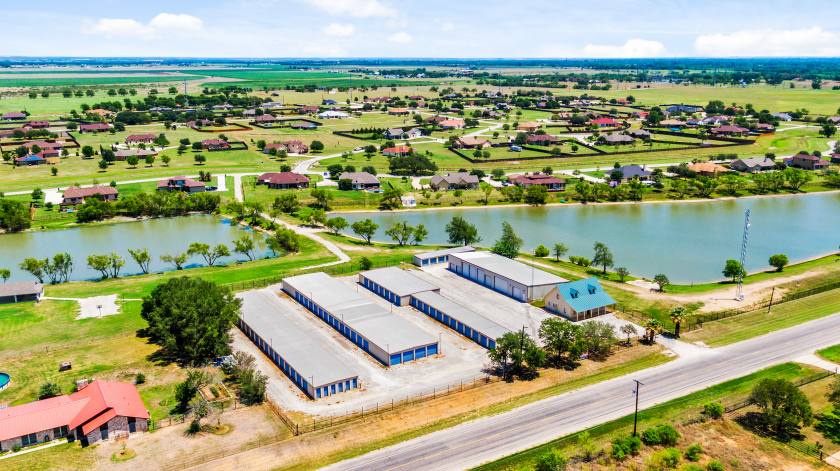
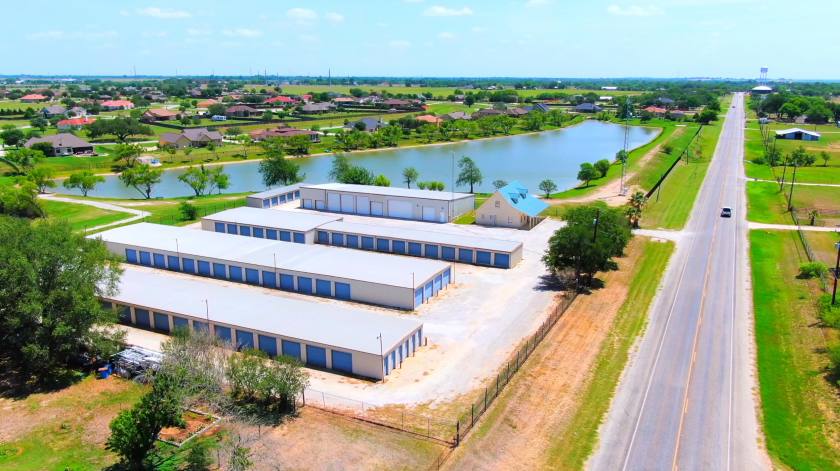
- • San Antonio MSA
Additional Photos
Listing Agents

Kristen Asman
O: 614-370-9077
kristen.asman@svn.com
O: 614-370-9077
kristen.asman@svn.com
While we strive to provide the most accurate information, all listing information, and demographic data, is provided by third-parties. As such, MyEListing will not be responsible for the accuracy of the information. It is strongly recommended that you verify all information with the listing agent, and any relevant agencies, prior to making any decisions.