Industrial Properties
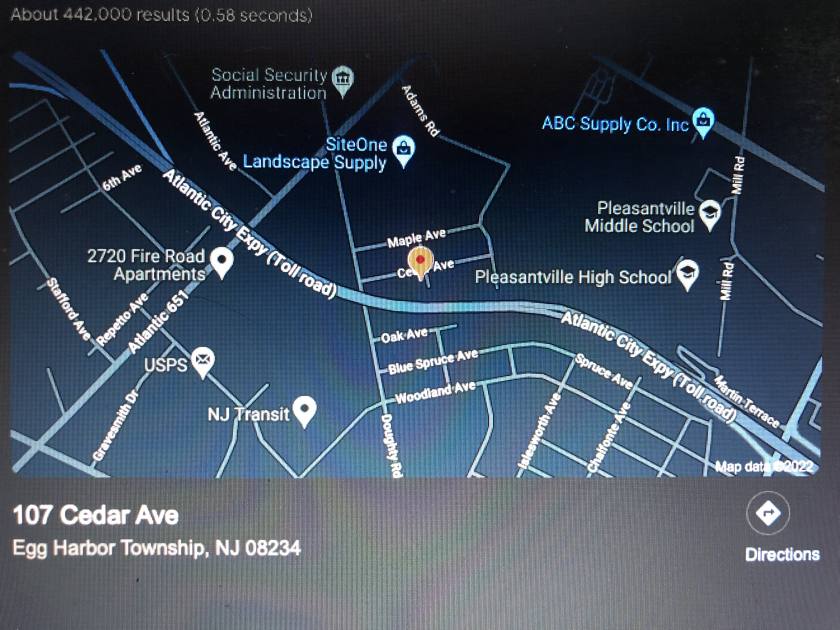
107 Cedar Avenue Egg Harbor Township, NJ 08234
107 Cedar Avenue Egg Harbor Township, NJ 08234
Details & Description
Property Highlights
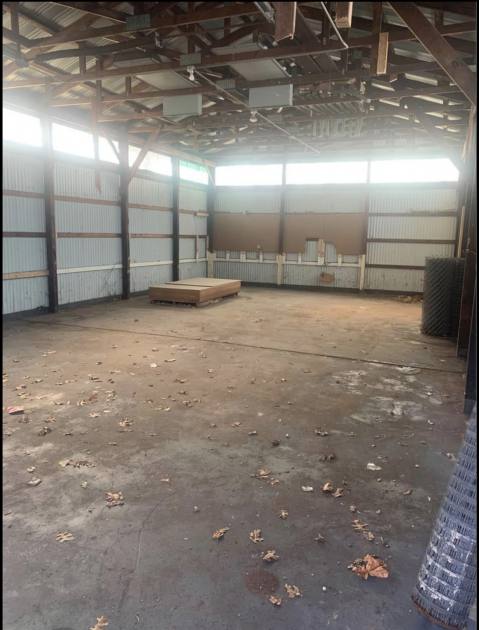
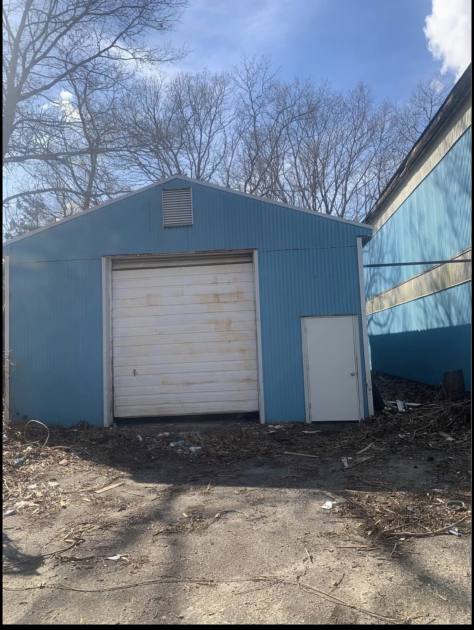
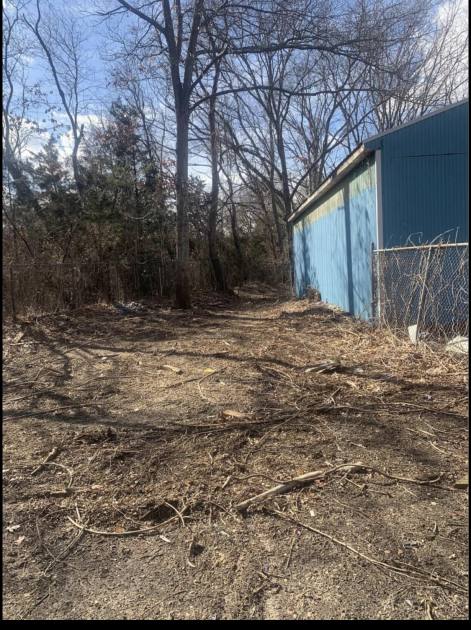
• 1500 square ft, 5000 sq ft lot, warehouse with large overhead door. Fenced in lot.
• Can accommodate buildout.Tenant Responsible for Electric.
Additional Photos

Listing Agents

Lisa Alaimo
realtyconnectgroup@gmail.com
realtyconnectgroup@gmail.com
While we strive to provide the most accurate information, all listing information, and demographic data, is provided by third-parties. As such, MyEListing will not be responsible for the accuracy of the information. It is strongly recommended that you verify all information with the listing agent, and any relevant agencies, prior to making any decisions.


