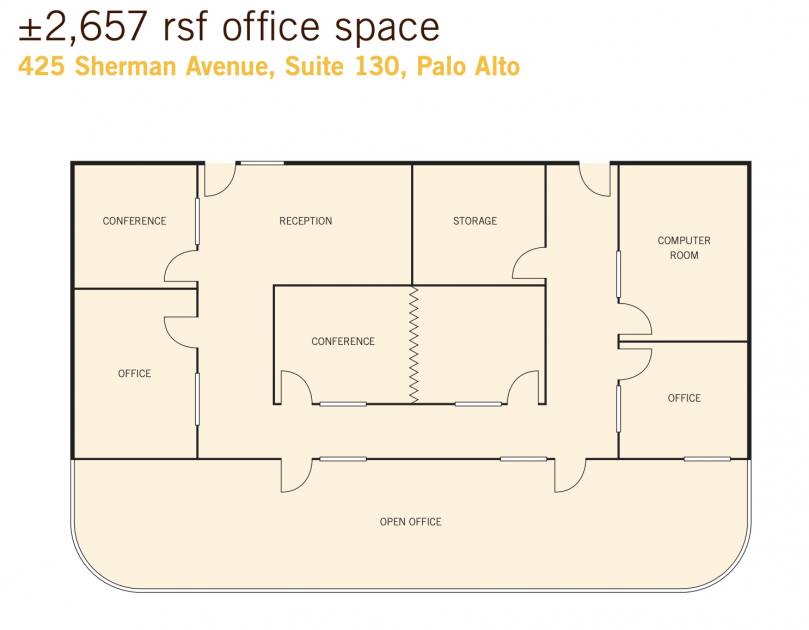
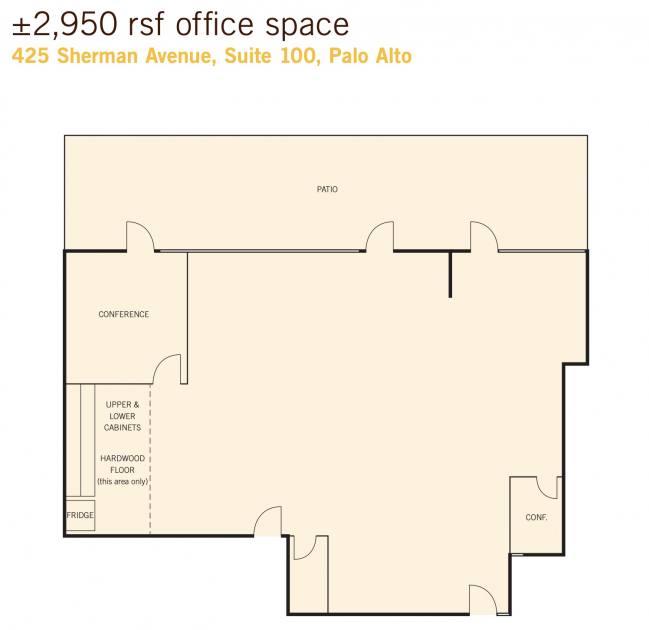
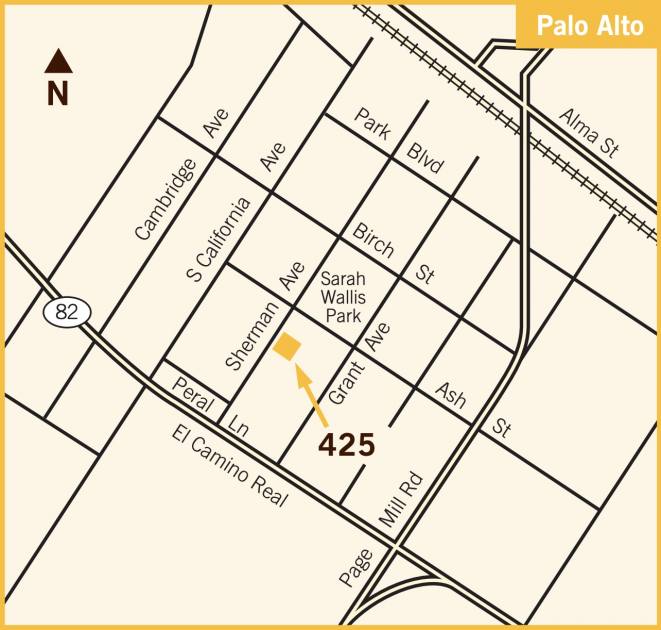
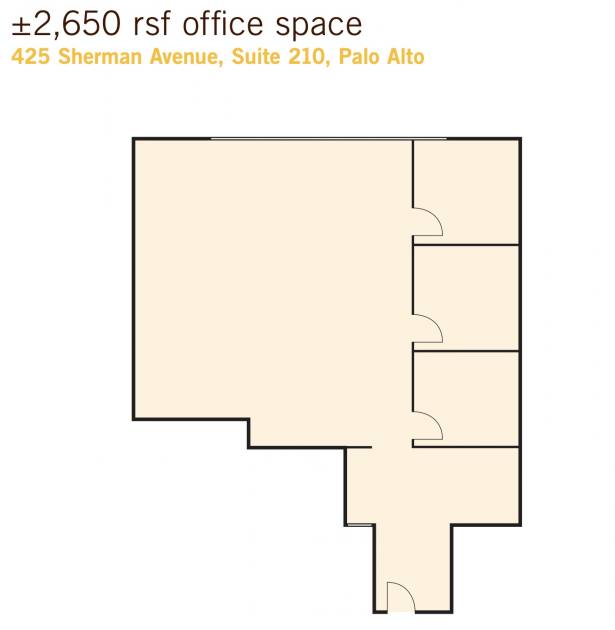
Office Space
425 Sherman Avenue Palo Alto, CA 94306
425 Sherman Avenue Palo Alto, CA 94306
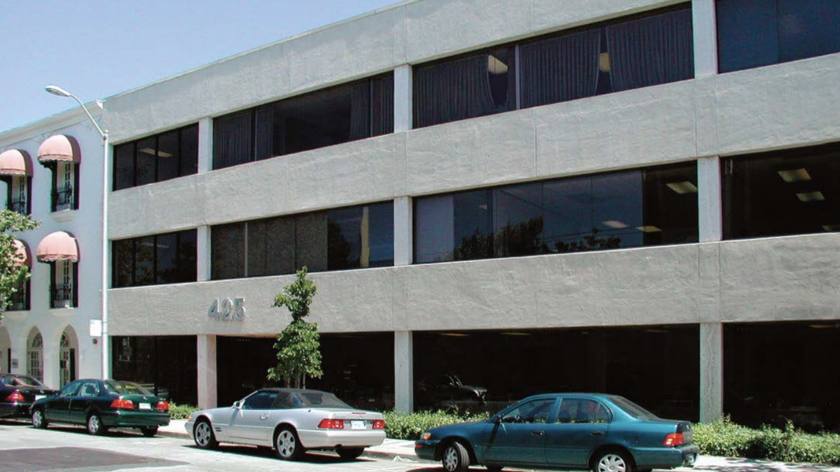
Details & Description
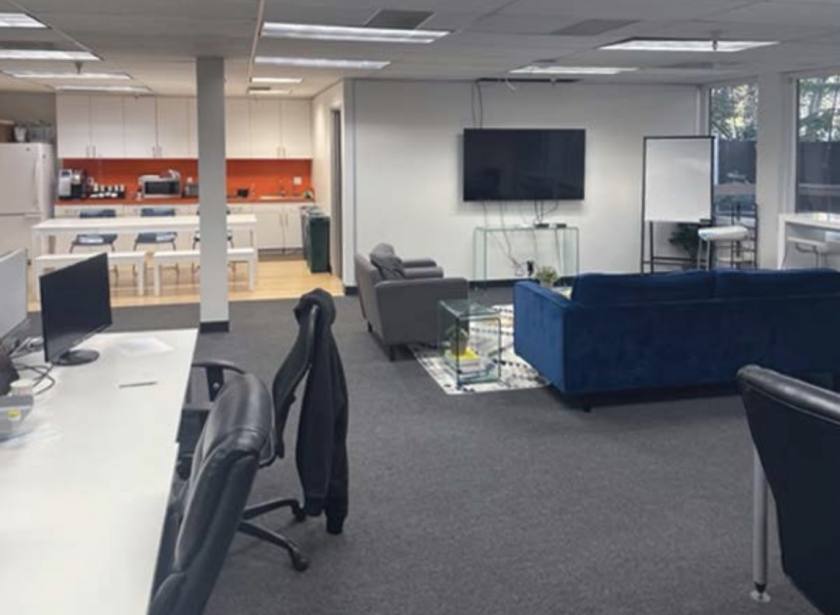
Property Highlights
- • Full Service Lease
- • Walk to CalTrain
- • Responsive local ownership and management
- • Ideal for start-up companies
- • Flexible lease term
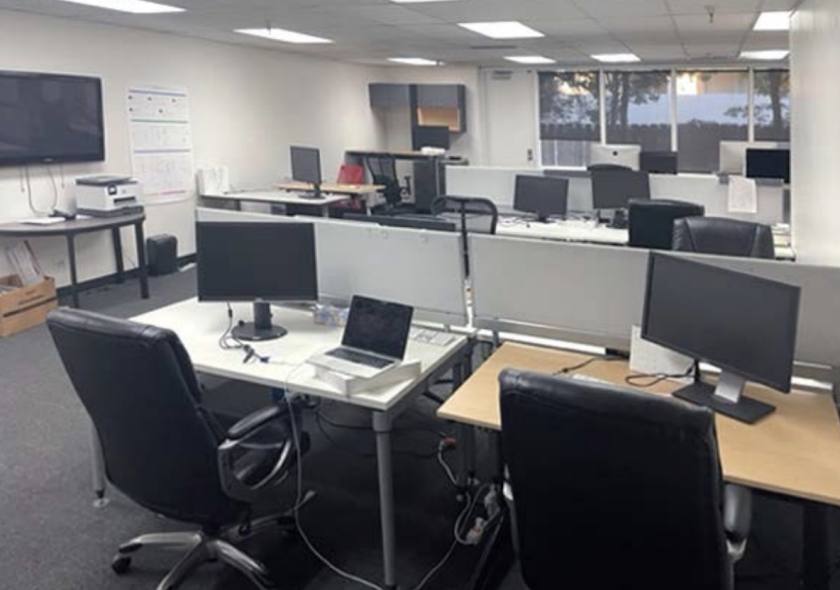
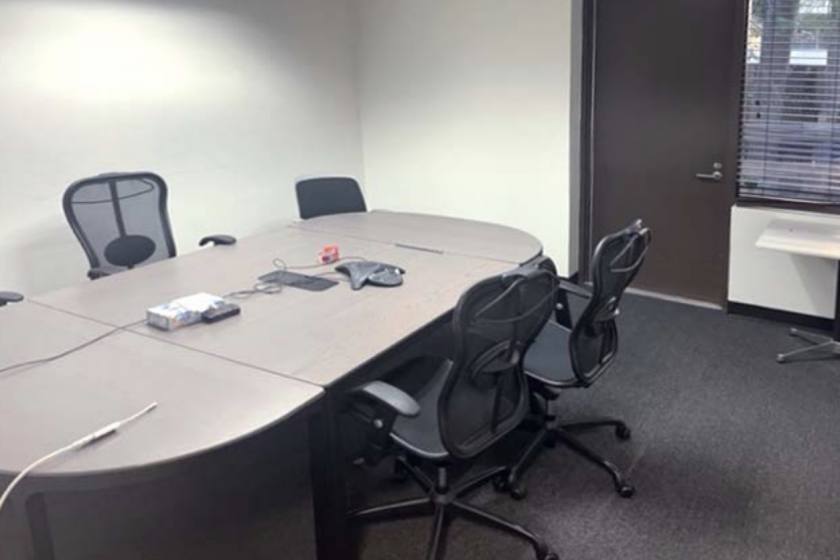
Additional Photos


Listing Agents

Leonard Ely
Renault & Handley
O: 650-321-3040
M: 650-461-2204
lely@renault-handley.com
Renault & Handley
O: 650-321-3040
M: 650-461-2204
lely@renault-handley.com

David Conklin
Renault & Handley
O: 650-321-3040
M: 650-461-2202
dconklin@renault-handley.com
Renault & Handley
O: 650-321-3040
M: 650-461-2202
dconklin@renault-handley.com
While we strive to provide the most accurate information, all listing information, and demographic data, is provided by third-parties. As such, MyEListing will not be responsible for the accuracy of the information. It is strongly recommended that you verify all information with the listing agent, and any relevant agencies, prior to making any decisions.