Retail Space
7031 East Route 20 Westfield, NY 14787
7031 East Route 20 Westfield, NY 14787

Details & Description
Property Highlights
- • 9,482 - SF Commercial Building
- • 1.10 - Acres
- • Dry Basement
- • New Septic 2004
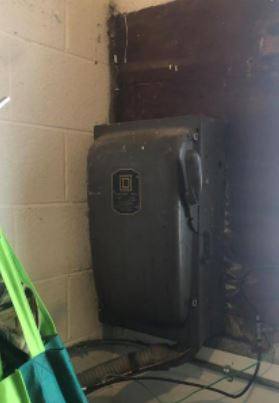
- • Electrical Completely rewired
- • New Rubber Roof 3 years old
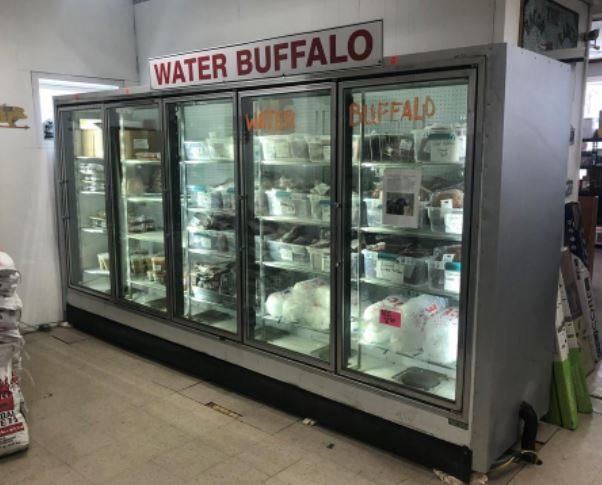
Additional Photos


Listing Agents

Rick Recckio
O: 716-631-5555
M: 716-998-4422
rick@recckio.com
O: 716-631-5555
M: 716-998-4422
rick@recckio.com
While we strive to provide the most accurate information, all listing information, and demographic data, is provided by third-parties. As such, MyEListing will not be responsible for the accuracy of the information. It is strongly recommended that you verify all information with the listing agent, and any relevant agencies, prior to making any decisions.