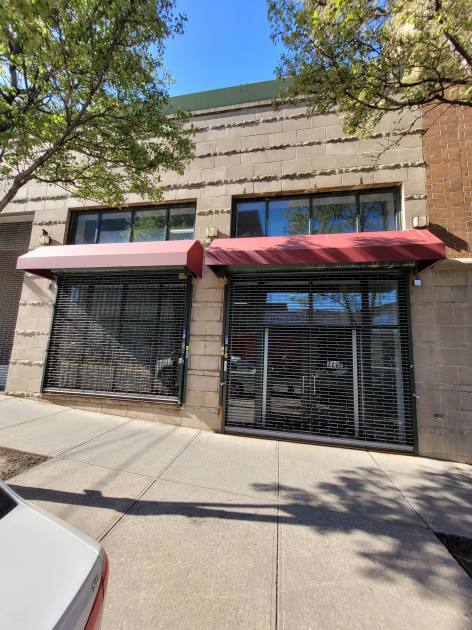
Retail Space
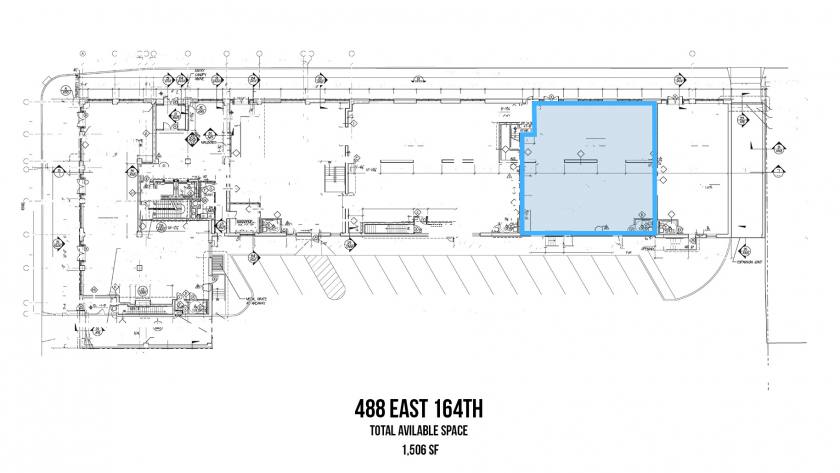
488 East 164th Street Bronx, NY 10456
488 East 164th Street Bronx, NY 10456
Details & Description
Property Highlights
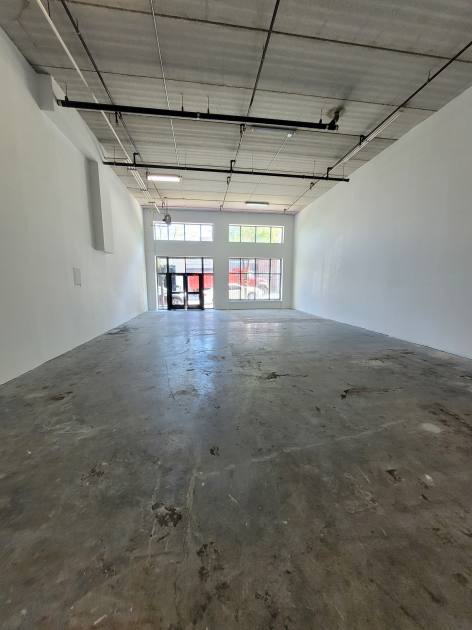
- • Located right near 3rd Ave
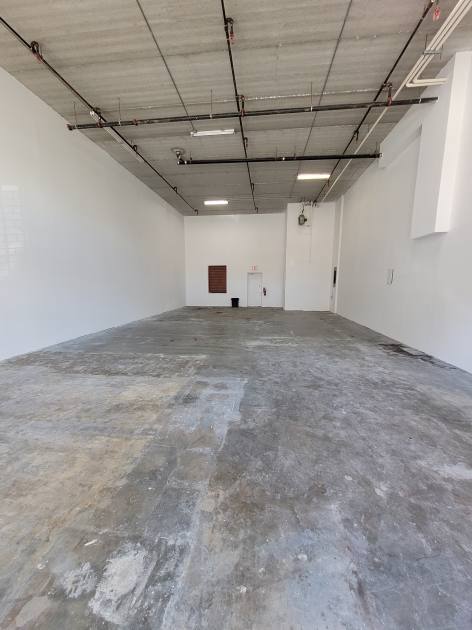
- • 20-foot ceilings
- • 25 feet of frontage
- • Can be easily vented
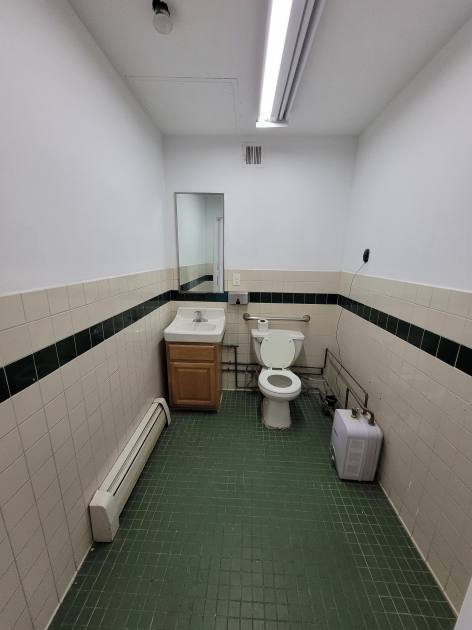
Additional Photos
Listing Agents

Shlomi Bagdadi
O: 718-437-6100
info@tristatecr.com
O: 718-437-6100
info@tristatecr.com
While we strive to provide the most accurate information, all listing information, and demographic data, is provided by third-parties. As such, MyEListing will not be responsible for the accuracy of the information. It is strongly recommended that you verify all information with the listing agent, and any relevant agencies, prior to making any decisions.


