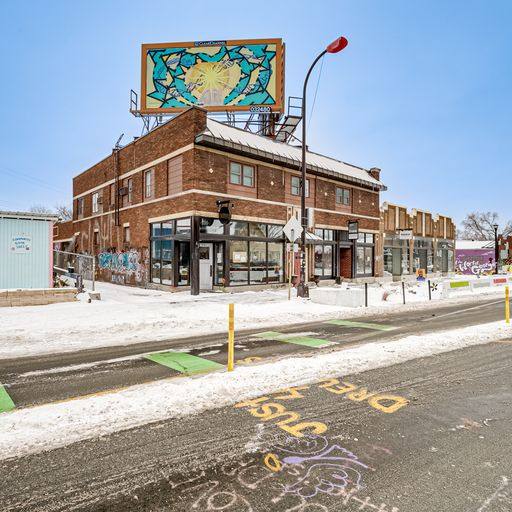
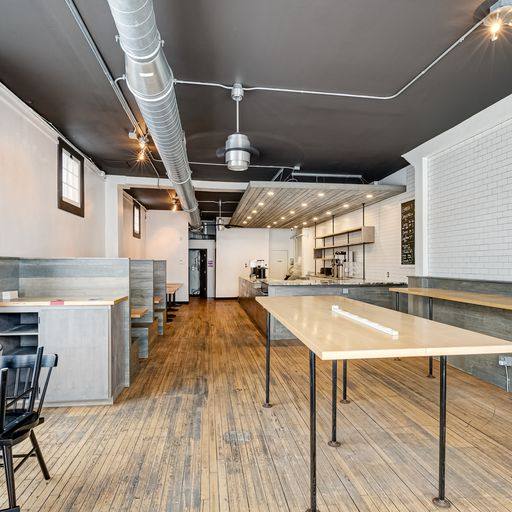
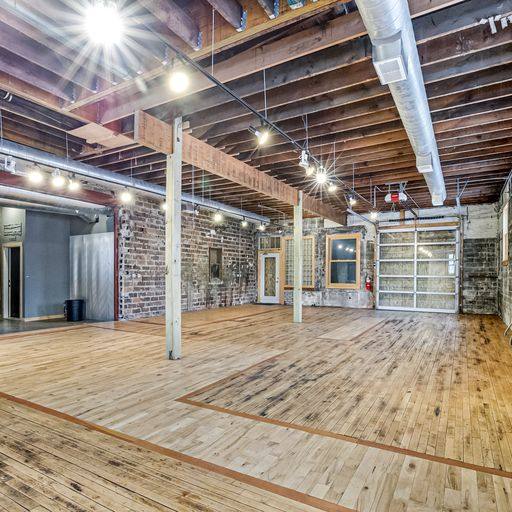
Retail Space
3740 Chicago Avenue Minneapolis, MN 55407
3740 Chicago Avenue Minneapolis, MN 55407
Details & Description
Property Highlights
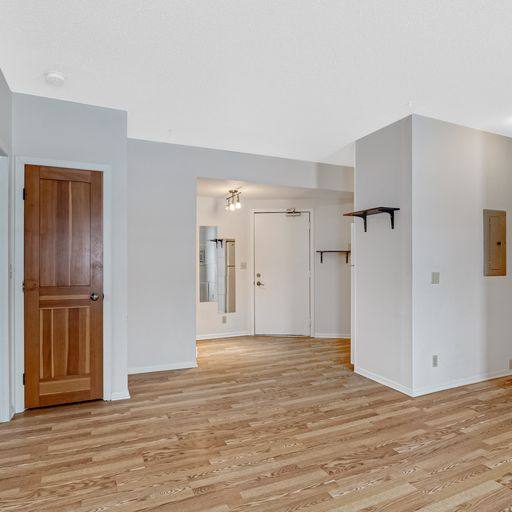
• Chicago Avenue Shops provides a unique investment opportunity with completely renovated retail residential components
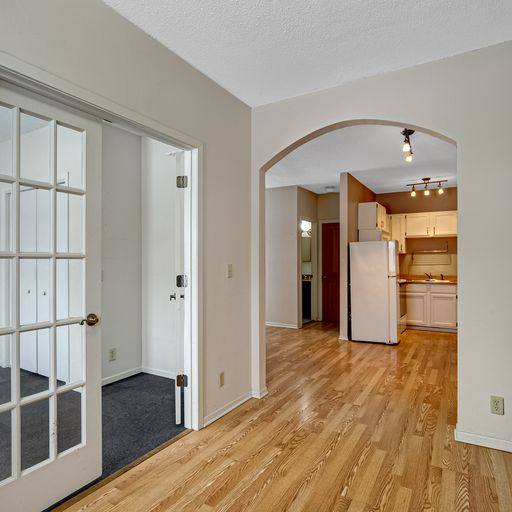
• Residential units have been completely renovated, new floors, appliances, woodwork, fixtures, sound absorbing floor.
Additional Photos

Listing Agents

Chad Macy
O: 952-852-9704
chad.macy@marcusmillichap.com
O: 952-852-9704
chad.macy@marcusmillichap.com
While we strive to provide the most accurate information, all listing information, and demographic data, is provided by third-parties. As such, MyEListing will not be responsible for the accuracy of the information. It is strongly recommended that you verify all information with the listing agent, and any relevant agencies, prior to making any decisions.