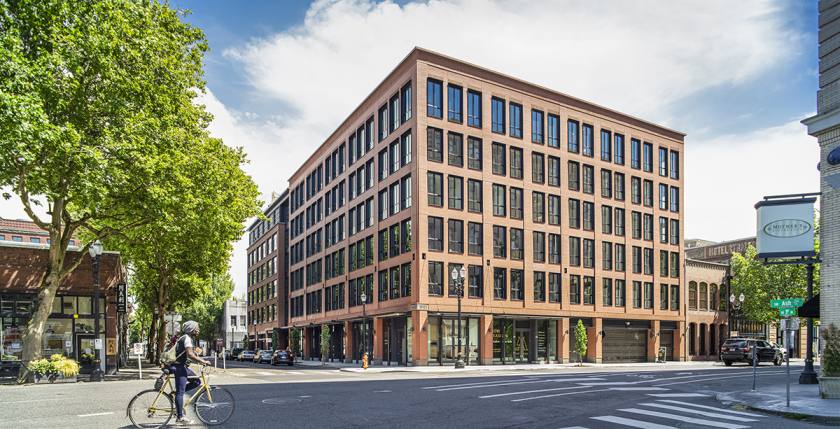
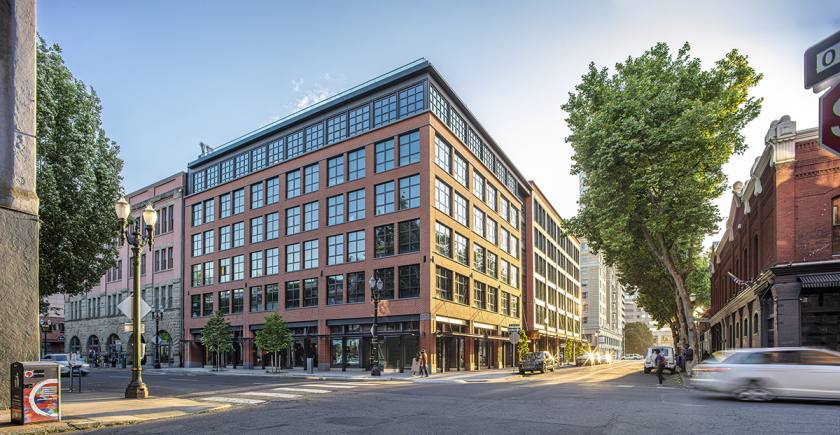
New 6-story construction featuring exterior brick, high ceilings (approximately 14 ft high), and expansive floor-to-ceiling storefront glass on ground floor retail with 133 apartments above, providing 24/7 site activation.
LEED Platinum Certified
First generation space can be customized per tenants’ design specifications.
Both spaces can accommodate type 1 venting and have accessible grease interceptors for restaurant use.
Sliding storefront windows.
Property has a roof deck for potential use for company events.
Day and night time private building security.
Tenants within a 1-block radius include: Afuri, BAE’s Fried Chicken, Stumptown Coffee Roasters, Mother’s Bistro, Voodoo Doughnut, Pine Street Market, Kells & more.
No part of this information may be copied, reproduced, repurposed, or screen-captured for any commercial purpose without prior written authorization from MyEListing.
While we strive to provide the most accurate information, all listing information, and demographic data, is provided by third-parties. As such, MyEListing will not be responsible for the accuracy of the information. It is strongly recommended that you verify all information with the listing agent, and any relevant agencies, prior to making any decisions.
What is the building size of this commercial Retail property?
The size of this multi-unit property varies between 1000 - 3981 square feet
What kind of Retail is the propery at 230 Southwest Ash Street?
The property at 230 Southwest Ash Street Portland, OR 97204 is listed as a Other Retail Retail property
What is the population within 1 mile of 230 Southwest Ash Street in Portland?
The population within 1 mile of 230 Southwest Ash Street Portland, OR 97204 is 34,340 people.
Who do I contact for questions about 230 Southwest Ash Street?
You should contact the listing agent,
Ashley Heichelbech, for any details regarding this commercial listing.