Retail Space
15770 Mojave Drive Victorville, CA 92394
15770 Mojave Drive Victorville, CA 92394

Details & Description
Property Highlights
- • Great Visibility
- • Busy Retail Center
- • Freeway Accessibility
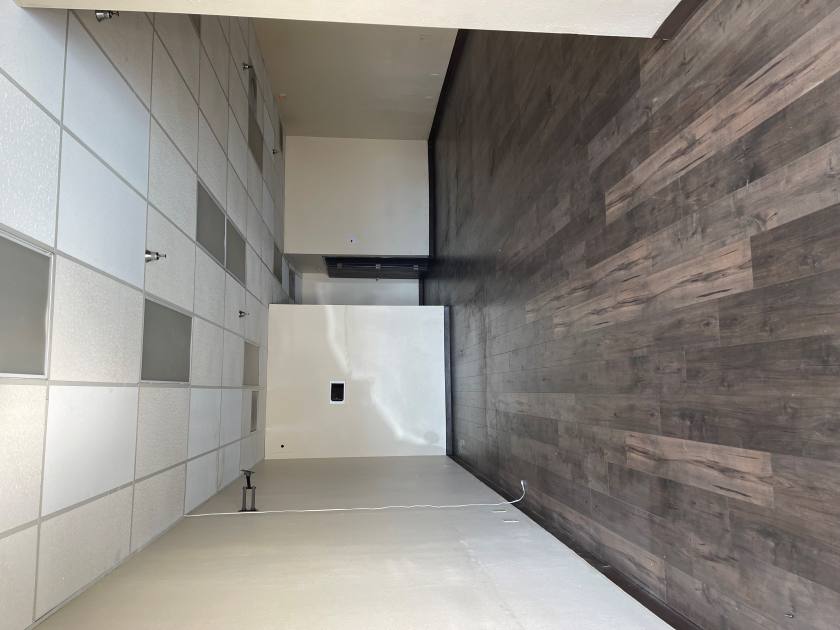
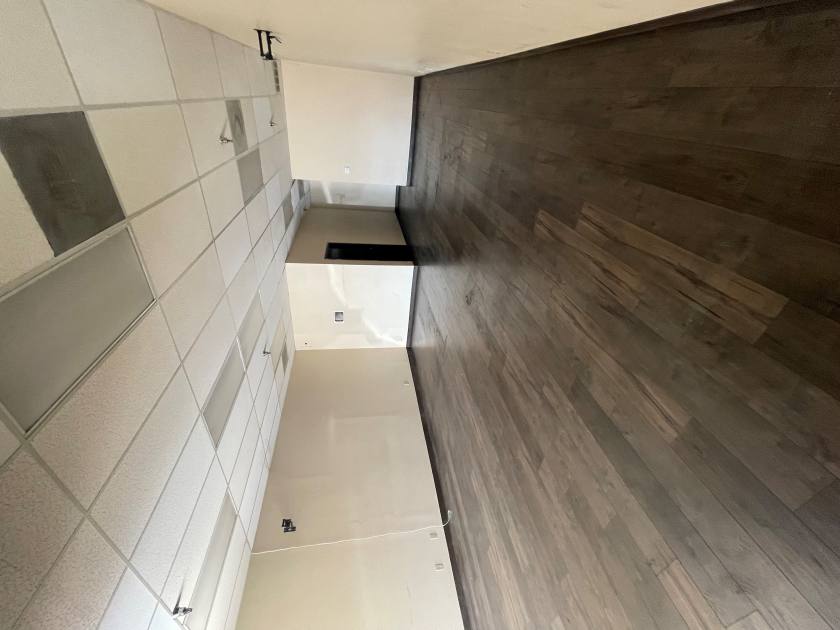
Additional Photos

Listing Agents

Elizabeth Brown
O: 760-684-4247
eabrown@lee-associates.com
O: 760-684-4247
eabrown@lee-associates.com
While we strive to provide the most accurate information, all listing information, and demographic data, is provided by third-parties. As such, MyEListing will not be responsible for the accuracy of the information. It is strongly recommended that you verify all information with the listing agent, and any relevant agencies, prior to making any decisions.


