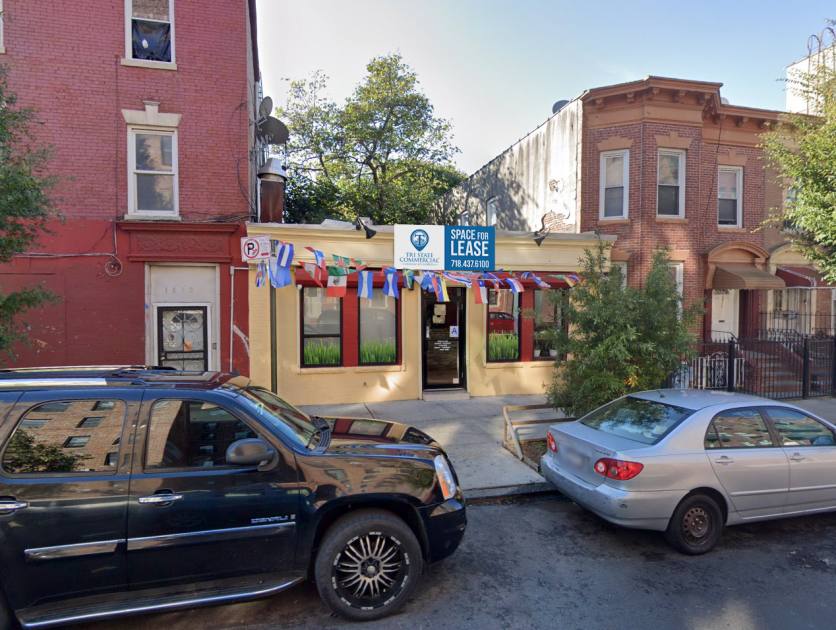
Retail Space
1610 Nostrand Avenue Brooklyn, NY 11226
1610 Nostrand Avenue Brooklyn, NY 11226
Details & Description
Property Highlights
• Ability to take up to 600 sq ft in basement (connect through the space by opening a sheetrock to stairs to base
• 300 luxury rental complex just finished construction half block away on Nostrand
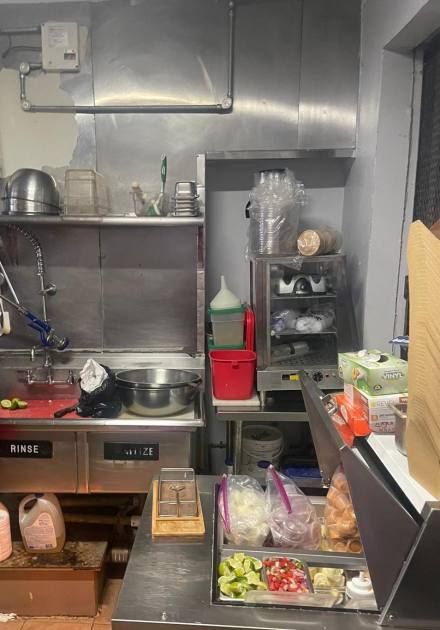
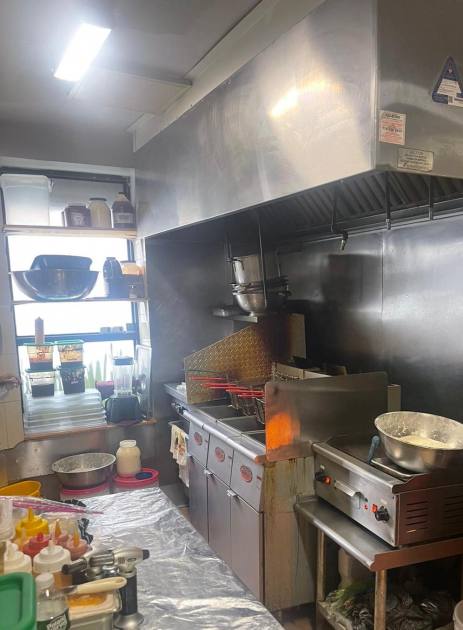
Additional Photos


Listing Agents

Shlomi Bagdadi
O: 718-437-6100
info@tristatecr.com
O: 718-437-6100
info@tristatecr.com
While we strive to provide the most accurate information, all listing information, and demographic data, is provided by third-parties. As such, MyEListing will not be responsible for the accuracy of the information. It is strongly recommended that you verify all information with the listing agent, and any relevant agencies, prior to making any decisions.


