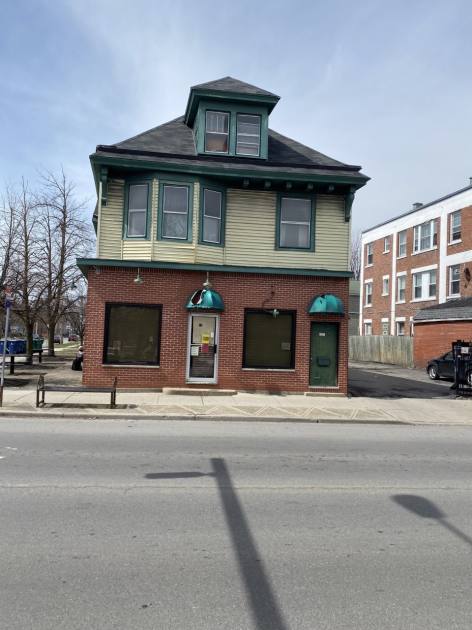
Retail Space
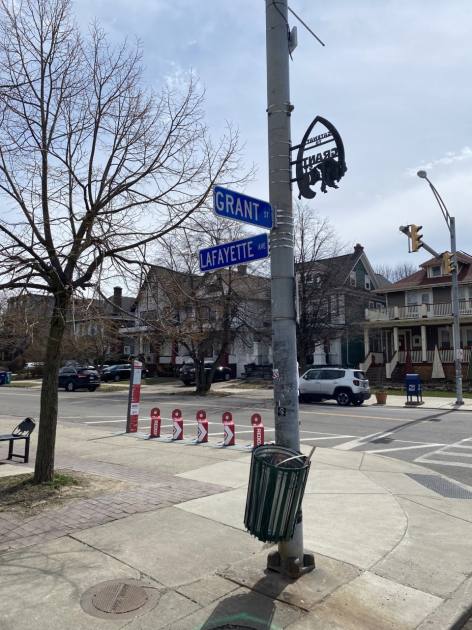
250 Grant Street Buffalo, NY 14213
250 Grant Street Buffalo, NY 14213

Details & Description
Property Highlights
- • Excellent Location
- • Multiple New Multifamily Developments in Area
- • 6 Residential Units
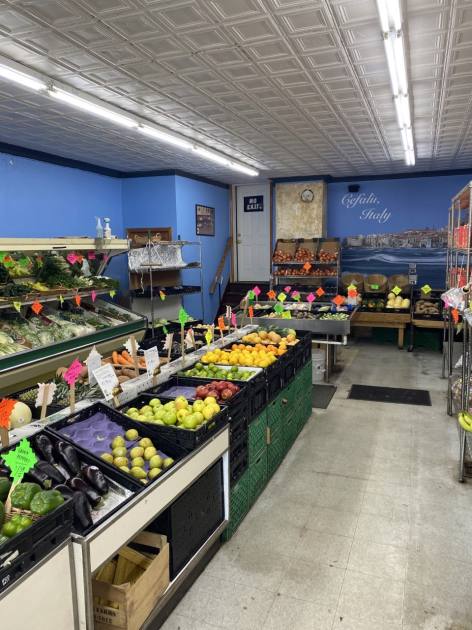
- • 3 Store Fronts
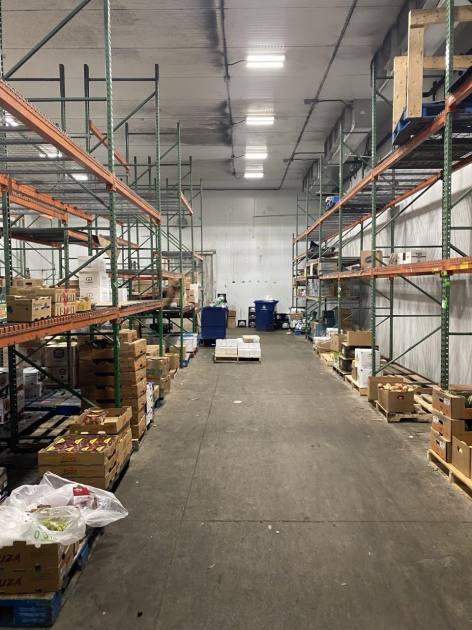
- • Refrigerated Warehouse
Additional Photos


Listing Agents

Rick Recckio
O: 716-631-5555
M: 716-998-4422
rick@recckio.com
O: 716-631-5555
M: 716-998-4422
rick@recckio.com
While we strive to provide the most accurate information, all listing information, and demographic data, is provided by third-parties. As such, MyEListing will not be responsible for the accuracy of the information. It is strongly recommended that you verify all information with the listing agent, and any relevant agencies, prior to making any decisions.