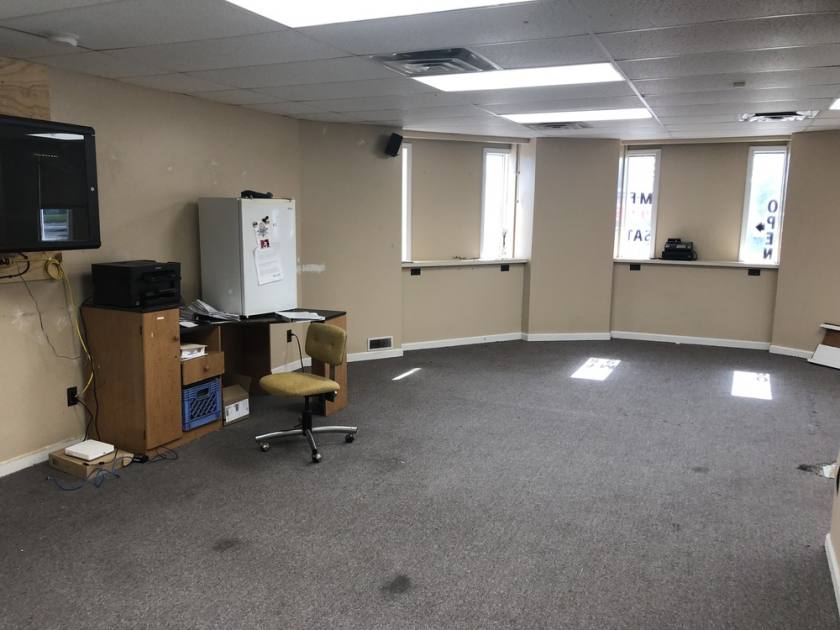
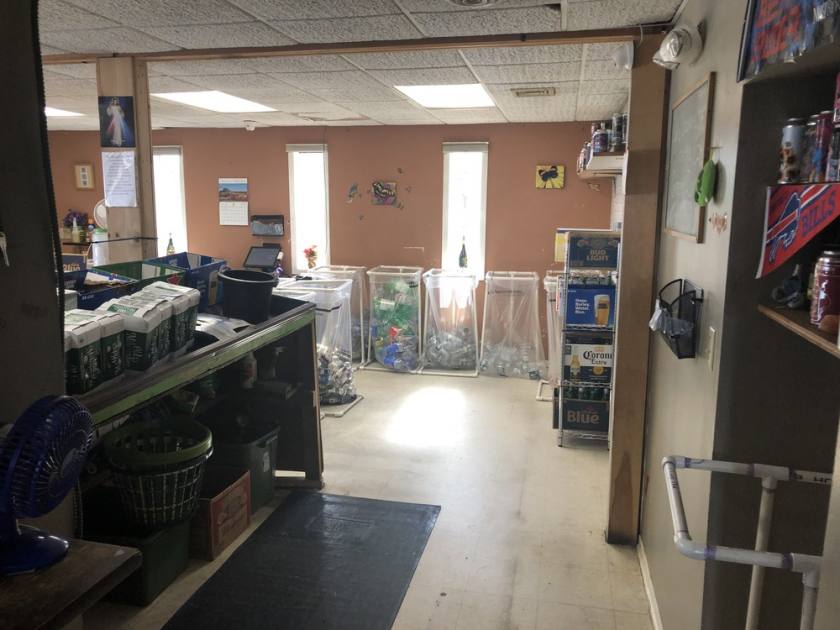
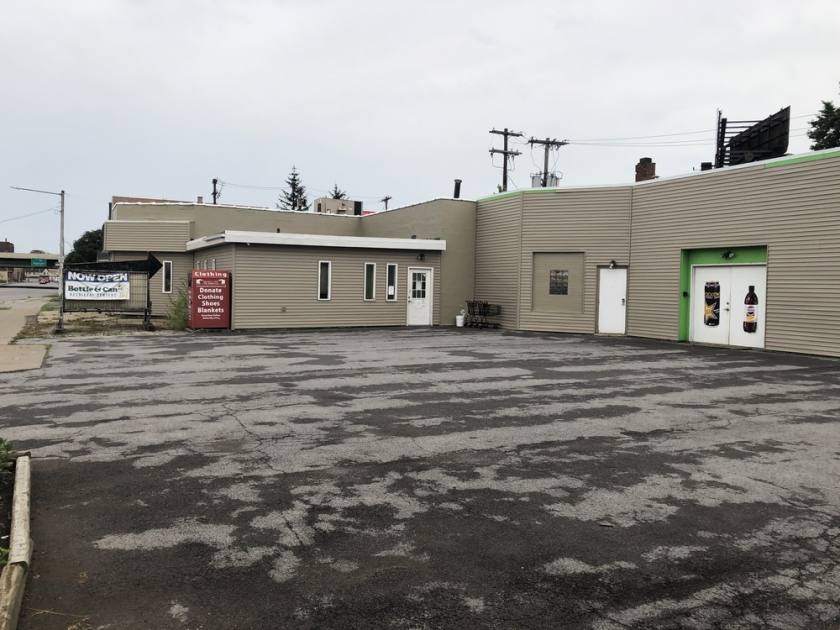
1-Mile | 3-Miles | 5-Miles | ||
---|---|---|---|---|
Total Population | 11,440 | 109,881 | 288,341 | |
Population Median Age | 40 | 39 | 39 | |
Population by Age | 0-9 Yrs | 1130 (9%) | 13600 (12%) | 34407 (11%) |
10-19 Yrs | 1230 (10%) | 12694 (11%) | 33901 (11%) | |
20-29 Yrs | 1722 (15%) | 16048 (14%) | 48102 (16%) | |
30-39 Yrs | 1687 (14%) | 15168 (13%) | 39285 (13%) | |
40-49 Yrs | 1246 (10%) | 12125 (11%) | 30944 (10%) | |
50-59 Yrs | 1876 (16%) | 16154 (14%) | 39214 (13%) | |
60-69 Yrs | 1331 (11%) | 13101 (11%) | 32297 (11%) | |
70+ Yrs | 1218 (10%) | 10991 (10%) | 30190 (10%) | |
Median HH Income | $40,910 | $39,948 | $41,694 | |
Total Household Income | < 24K | 1516 (29%) | 16111 (33%) | 40295 (31%) |
25-49K | 1619 (31%) | 12367 (25%) | 32517 (25%) | |
50-74K | 904 (17%) | 8366 (17%) | 21830 (17%) | |
75-99K | 642 (12%) | 5418 (11%) | 13836 (10%) | |
100-199K | 509 (9%) | 5560 (11%) | 16334 (12%) | |
200K+ | 19 (0%) | 552 (1%) | 2665 (2%) | |
Highest Education Level | No Diploma | 1250 | 11020 | 26157 |
Diploma or GED | 3393 | 26619 | 62327 | |
Some College | 1435 | 15872 | 39559 | |
Assoc. Degree | 951 | 8974 | 22359 | |
Bachelors Degree | 970 | 9351 | 28882 | |
Higher Degree | 425 | 4690 | 19100 | |
Total Housing Units | 6,162 | 57,413 | 147,737 | |
--Owner-Occupied | 2,967 | 25,795 | 62,867 | |
--Renter-Occupied | 2,242 | 22,577 | 64,611 | |
Owner-Occupied Values | < 100K | 2454 | 15586 | 30526 |
100-199K | 388 | 8613 | 23258 | |
200-299K | 4 | 758 | 4306 | |
300-399K | 23 | 217 | 1880 | |
400-499K | 9 | 83 | 1015 | |
500K+ | 89 | 538 | 1882 | |
Total Working Age Population | 9,624 | 88,361 | 234,002 | |
In Work Force | 6,029 | 54,039 | 143,322 | |
Not In Work Force | 3,595 | 34,323 | 90,680 | |
Workforce Employed | 5,625 | 50,030 | 133,821 | |
Workforce Unemployed | 389 | 3,978 | 9,367 | |
Civlian Workforce | 6,014 | 54,007 | 143,188 | |
Military Workforce | 15 | 31 | 134 | |
Total Households | 5,209 | 48,373 | 127,478 | |
Family Households | 2,702 | 26,475 | 67,135 | |
Non-Family Households | 2,507 | 21,898 | 60,343 | |
Married Couple | 1,662 | 14,344 | 36,498 | |
Other Family | 1,040 | 12,130 | 30,637 | |
Married w/Child | 535 | 5,061 | 13,130 | |
Single Male w/Child | 117 | 1,181 | 2,837 | |
Single Female w/Child | 372 | 5,099 | 13,379 |
Population Change Last Two Decades - Plus Projection
2000 | % | 2010 | % | 2020 | % | 2030 | |
---|---|---|---|---|---|---|---|
New York | 18,976,457 | +2 | 19,378,102 | +4 | 20,146,131 | +2 | 20,604,030 |
Erie County | 950,265 | -3 | 919,040 | +2 | 936,084 | +1 | 949,073 |
Total Working Age Population:
Total Households:
Total Working Age Population:
Total Households:
Total Working Age Population:
Total Households: