Flex-Office-Warehouse
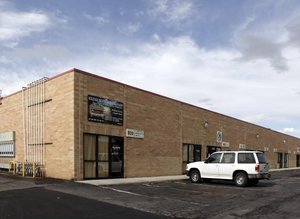
3667 West 2100 South Salt Lake City, UT 84104
3667 West 2100 South Salt Lake City, UT 84104

Details & Description
Property Highlights
• Flex/Retail/Office at Broadbent Business Park
• Flex/Retail/Office at Broadbent Business Park
Listing Agents

Matt Mangum
O: 801-617-1700
matt.mangum@crcnationwide.com
O: 801-617-1700
matt.mangum@crcnationwide.com

Derek Klopfer
O: 801-617-1705
derek.klopfer@crcnationwide.com
O: 801-617-1705
derek.klopfer@crcnationwide.com

Colter Smith
cRc Nationwide
O: 801-617-1700
colter.smith@crcnationwide.com
cRc Nationwide
O: 801-617-1700
colter.smith@crcnationwide.com
While we strive to provide the most accurate information, all listing information, and demographic data, is provided by third-parties. As such, MyEListing will not be responsible for the accuracy of the information. It is strongly recommended that you verify all information with the listing agent, and any relevant agencies, prior to making any decisions.