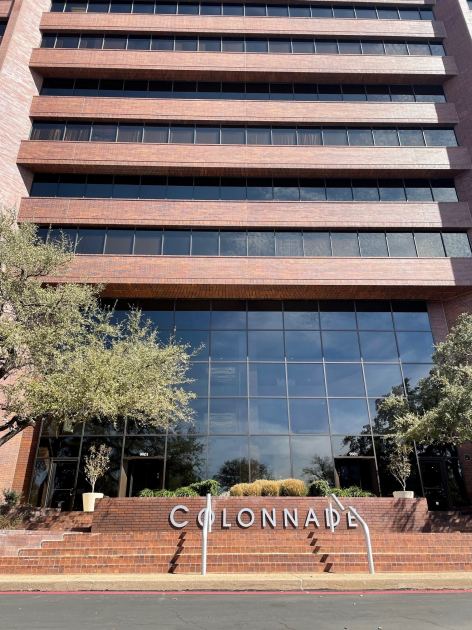
Office Space
9901 Interstate 10 San Antonio, TX 78230
9901 Interstate 10 San Antonio, TX 78230
Details & Description
Property Highlights
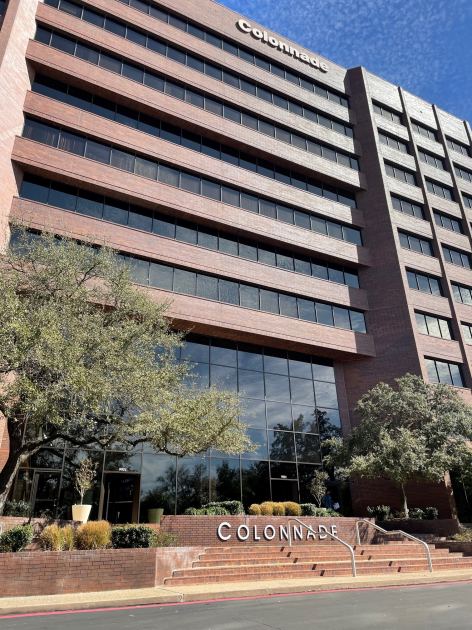
- • Superior visibility and location in the Northwest
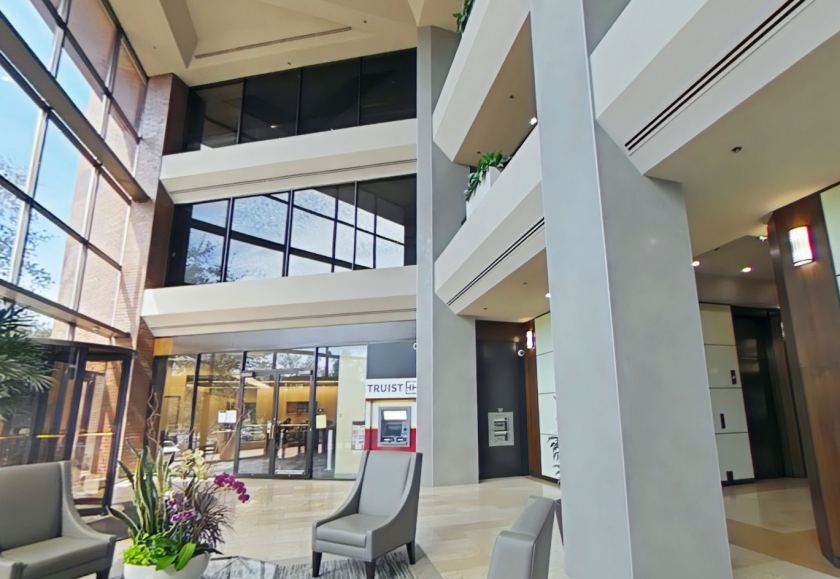
- • Abundant walkable amenities
- • Convenient access from IH-10
- • Covered parking in attached garage
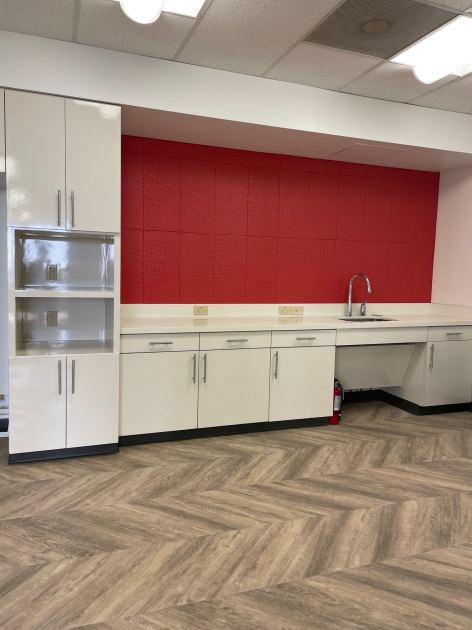
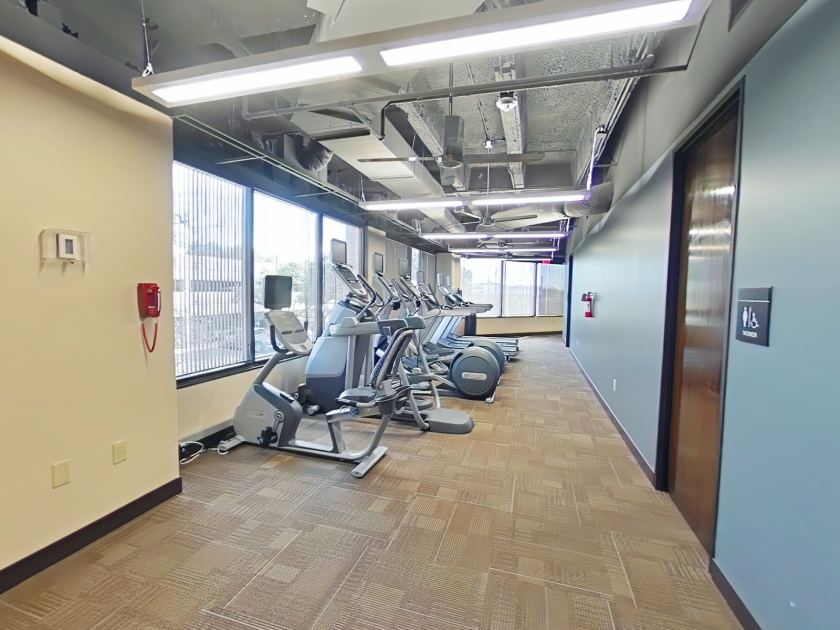
- • Building conference and training rooms
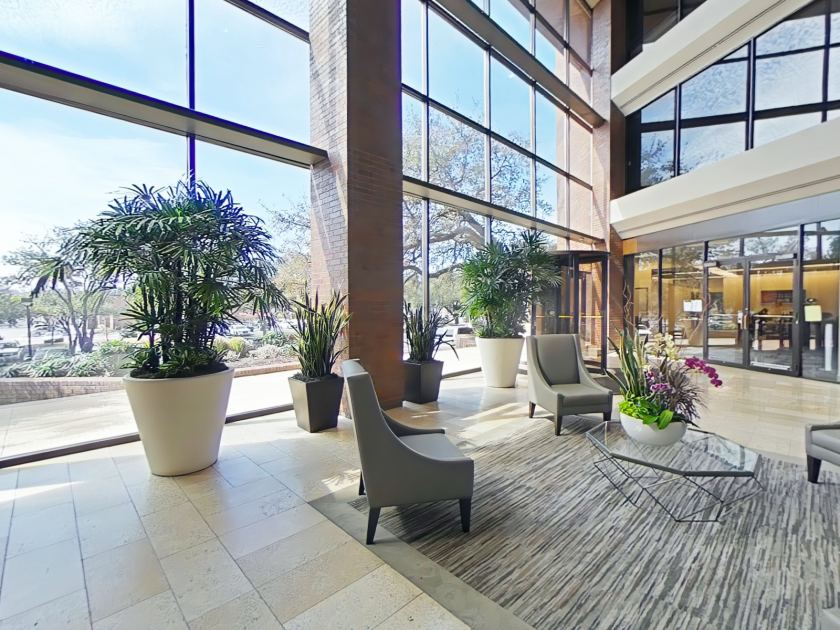
Additional Photos
Listing Agents

Paul Barker
M: 210-601-8127
pbarker@endurasa.com
M: 210-601-8127
pbarker@endurasa.com
While we strive to provide the most accurate information, all listing information, and demographic data, is provided by third-parties. As such, MyEListing will not be responsible for the accuracy of the information. It is strongly recommended that you verify all information with the listing agent, and any relevant agencies, prior to making any decisions.