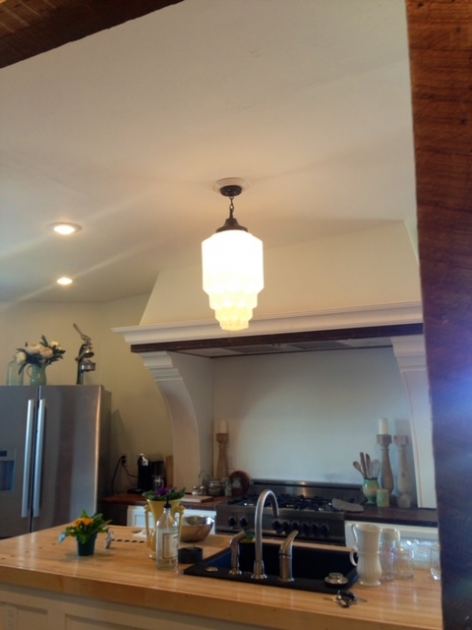
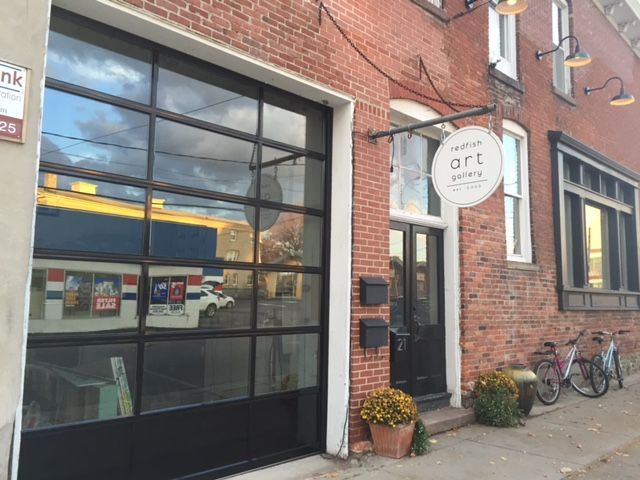
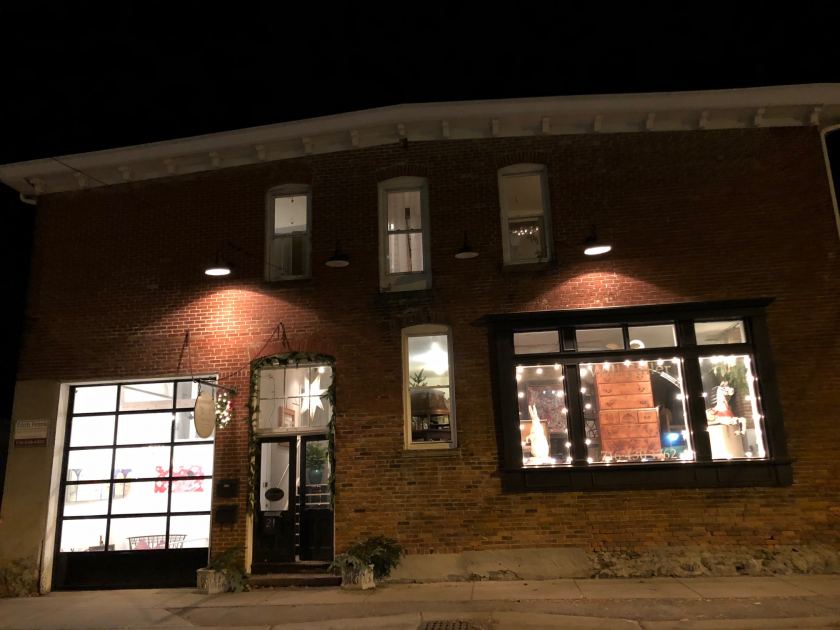
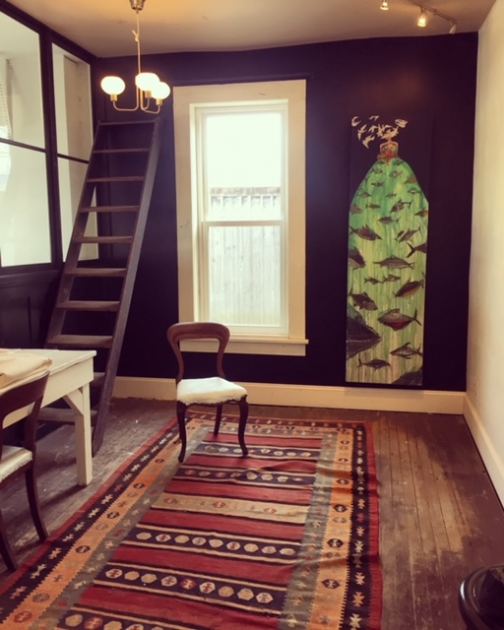
Multifamily Housing
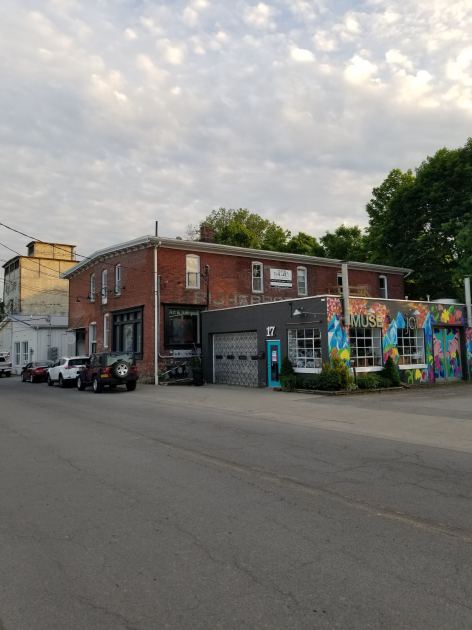
17-21 Elm Street East Aurora, NY 14052
17-21 Elm Street East Aurora, NY 14052
Details & Description
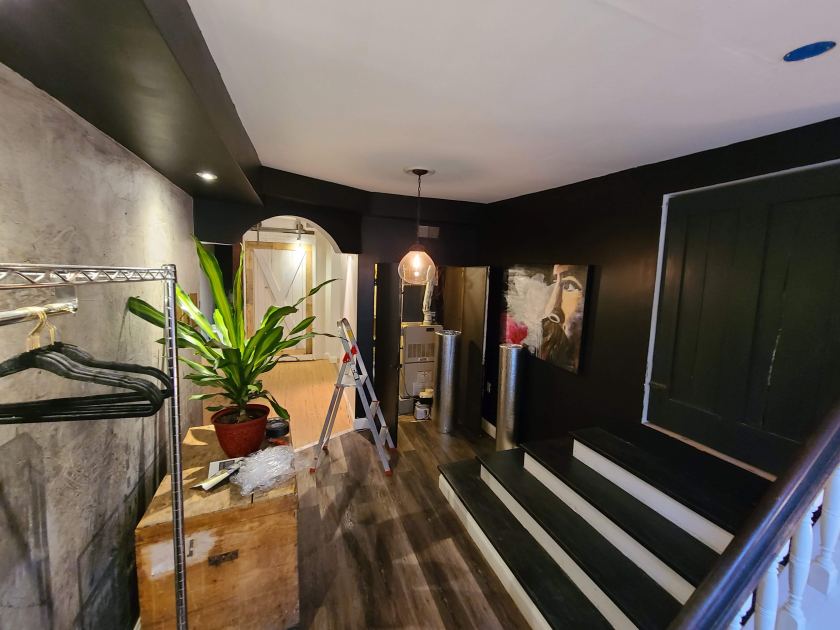
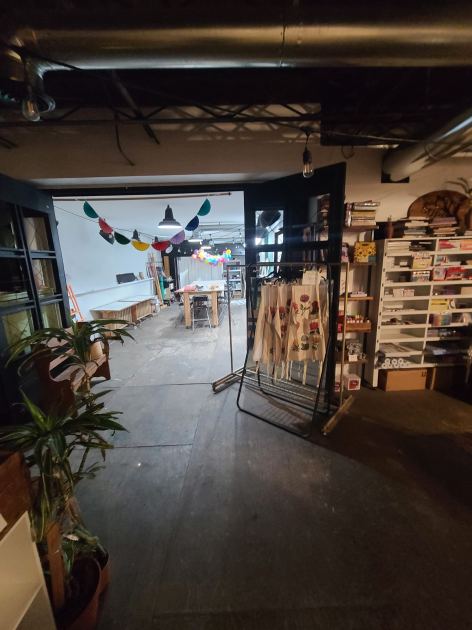
Additional Photos


Listing Agents

J Gerard Green
REMAX Precision
O: 716-805-3241
M: 716-866-8307
jgerard.green@remax.net
REMAX Precision
O: 716-805-3241
M: 716-866-8307
jgerard.green@remax.net
While we strive to provide the most accurate information, all listing information, and demographic data, is provided by third-parties. As such, MyEListing will not be responsible for the accuracy of the information. It is strongly recommended that you verify all information with the listing agent, and any relevant agencies, prior to making any decisions.