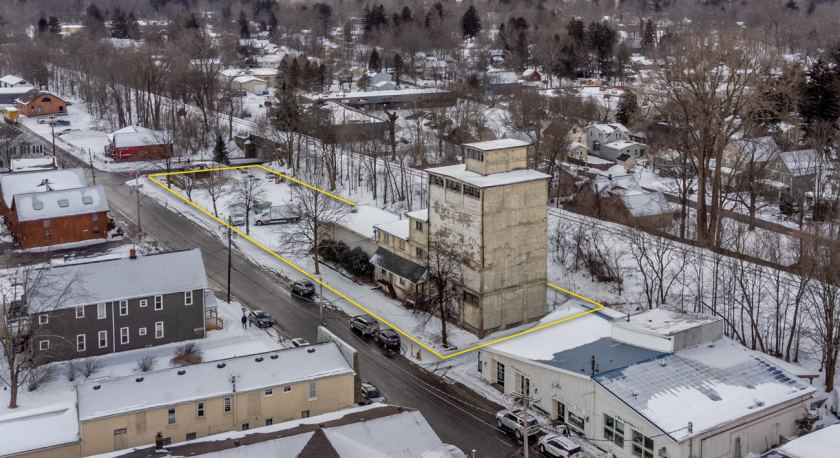
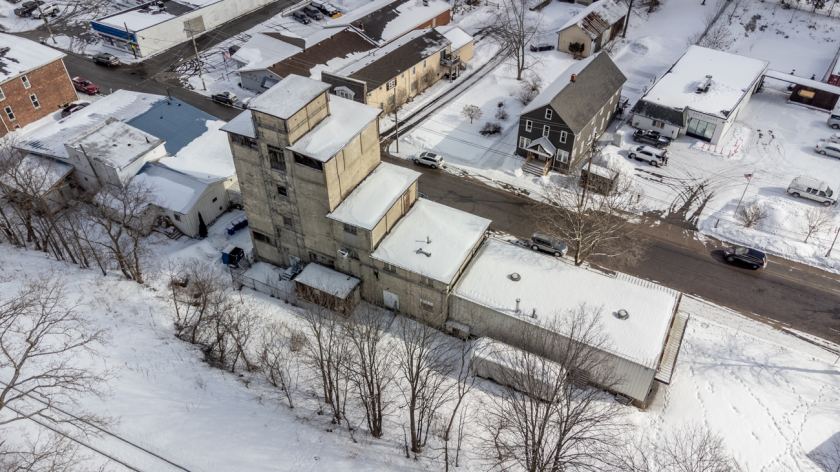
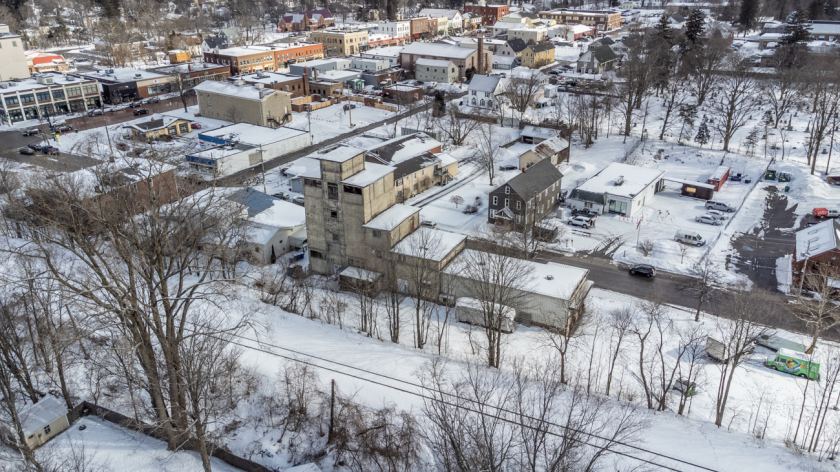
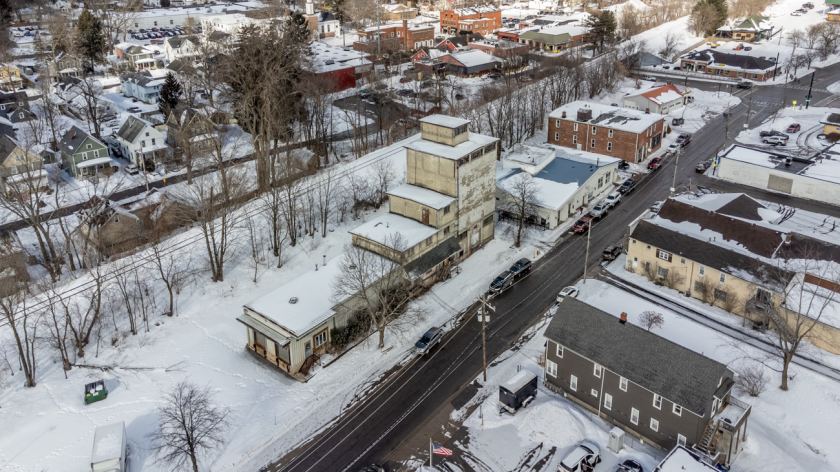
1-Mile | 3-Miles | 5-Miles | ||
---|---|---|---|---|
Total Population | 5,571 | 12,476 | 25,043 | |
Population Median Age | 44 | 45 | 44 | |
Population by Age | 0-9 Yrs | 537 (9%) | 1015 (8%) | 2273 (9%) |
10-19 Yrs | 683 (12%) | 1427 (11%) | 2944 (11%) | |
20-29 Yrs | 473 (8%) | 1291 (10%) | 2505 (10%) | |
30-39 Yrs | 580 (10%) | 1304 (10%) | 2420 (9%) | |
40-49 Yrs | 709 (12%) | 1496 (11%) | 3098 (12%) | |
50-59 Yrs | 971 (17%) | 2364 (18%) | 4601 (18%) | |
60-69 Yrs | 590 (10%) | 1451 (11%) | 3244 (12%) | |
70+ Yrs | 1028 (18%) | 2128 (17%) | 3958 (15%) | |
Median HH Income | $78,661 | $80,501 | $82,488 | |
Total Household Income | < 24K | 291 (12%) | 602 (11%) | 1097 (10%) |
25-49K | 370 (16%) | 888 (17%) | 1725 (16%) | |
50-74K | 420 (18%) | 946 (18%) | 1894 (18%) | |
75-99K | 328 (14%) | 660 (12%) | 1329 (12%) | |
100-199K | 682 (30%) | 1634 (31%) | 3238 (31%) | |
200K+ | 168 (7%) | 433 (8%) | 944 (9%) | |
Highest Education Level | No Diploma | 141 | 387 | 765 |
Diploma or GED | 914 | 2041 | 4237 | |
Some College | 566 | 1441 | 2758 | |
Assoc. Degree | 520 | 1289 | 2515 | |
Bachelors Degree | 1154 | 2496 | 4686 | |
Higher Degree | 873 | 1757 | 3595 | |
Total Housing Units | 2,422 | 5,506 | 10,880 | |
--Owner-Occupied | 1,730 | 4,080 | 8,332 | |
--Renter-Occupied | 529 | 1,082 | 1,895 | |
Owner-Occupied Values | < 100K | 45 | 140 | 343 |
100-199K | 659 | 1454 | 2656 | |
200-299K | 617 | 1350 | 2787 | |
300-399K | 283 | 682 | 1386 | |
400-499K | 66 | 275 | 604 | |
500K+ | 60 | 178 | 555 | |
Total Working Age Population | 4,569 | 10,525 | 20,943 | |
In Work Force | 2,776 | 6,663 | 13,537 | |
Not In Work Force | 1,793 | 3,862 | 7,405 | |
Workforce Employed | 2,669 | 6,422 | 13,094 | |
Workforce Unemployed | 107 | 240 | 439 | |
Civlian Workforce | 2,776 | 6,662 | 13,533 | |
Military Workforce | 0 | 1 | 5 | |
Total Households | 2,259 | 5,162 | 10,227 | |
Family Households | 1,479 | 3,416 | 6,977 | |
Non-Family Households | 780 | 1,746 | 3,250 | |
Married Couple | 1,154 | 2,815 | 5,893 | |
Other Family | 324 | 601 | 1,083 | |
Married w/Child | 412 | 893 | 1,979 | |
Single Male w/Child | 14 | 62 | 156 | |
Single Female w/Child | 162 | 267 | 398 |
Population Change Last Two Decades - Plus Projection
2000 | % | 2010 | % | 2020 | % | 2030 | |
---|---|---|---|---|---|---|---|
New York | 18,976,457 | +2 | 19,378,102 | +4 | 20,146,131 | +2 | 20,604,030 |
Erie County | 950,265 | -3 | 919,040 | +2 | 936,084 | +1 | 949,073 |
Total Working Age Population:
Total Households:
Total Working Age Population:
Total Households:
Total Working Age Population:
Total Households: